Council on Energy, Environment and Water Integrated | International | Independent
Abhishek Jain, Sunil Mani, Sasmita Patnaik, Karthik Ganesan
November 2018 | Energy Transitions, Power Markets
Citation: Jain, Abhishek, Saurabh Tripathi, Sunil Mani, Sasmita Patnaik, Tauseef Shahidi, and Karthik Ganesan. 2018. Access to Clean Cooking Energy and Electricity: Survey of States 2018. New Delhi: CEEW.
The Access to Clean Cooking Energy and Electricity – Survey of States (ACCESS) is India’s largest multidimensional survey on energy access. The largest panel-data on energy access in India, the survey is conducted across six of the major energy-access-deprived states in the country – Bihar, Jharkhand, Madhya Pradesh, Odisha, Uttar Pradesh, and West Bengal.
The 2018 study conducted by CEEW, with support from the Shakti Sustainable Energy Foundation (SSEF) and the Lee Kuan Yew School of Public Policy (National University of Singapore), covered more than 9,000 households from 756 villages in 54 districts collecting about 2.5 million data points.
The results from the first round of the study, ACCESS 2015, highlighted the need to look beyond connections to enable rural India’s access to modern forms of energy. In 2018, we revisited the households to understand the changes in their energy access situation over the last three years, and to study the impact of government policies during this period.
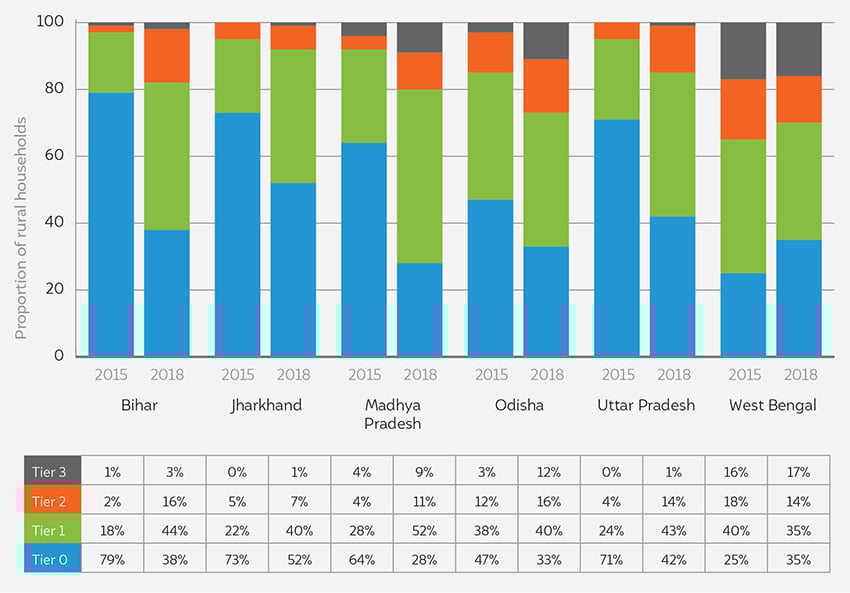
The study analyses energy access for households using a multidimensional, multi-tier framework. Households are assigned tiers on the basis of their level of access to energy. Tier 0 indicates the lowest level of access and Tier 3, the highest.
Source: CEEW analysis, 2018
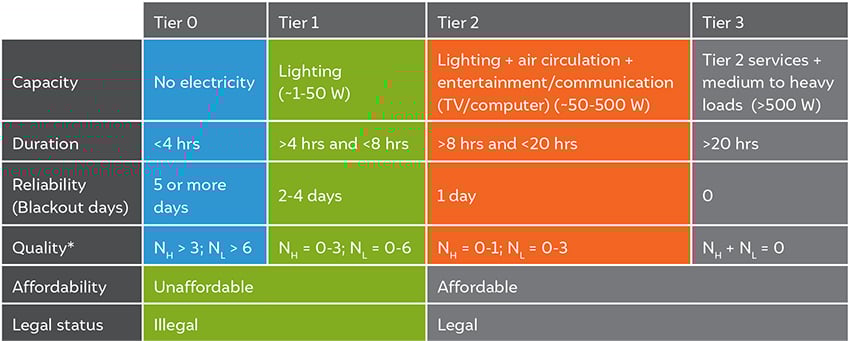
*NH is the number of high-voltage days in a month causing appliance damage; NL is the number of low-voltage days in a month limiting appliance usage. NOTE: For dimensions where the categories span multiple tiers, only the higher tier values apply. For example, affordability can only be categorised as Tier 1 or Tier 3. The same is the case for legal status.
(Source: CEEW analysis, 2015)
On electricity access:
Source: CEEW analysis, 2018
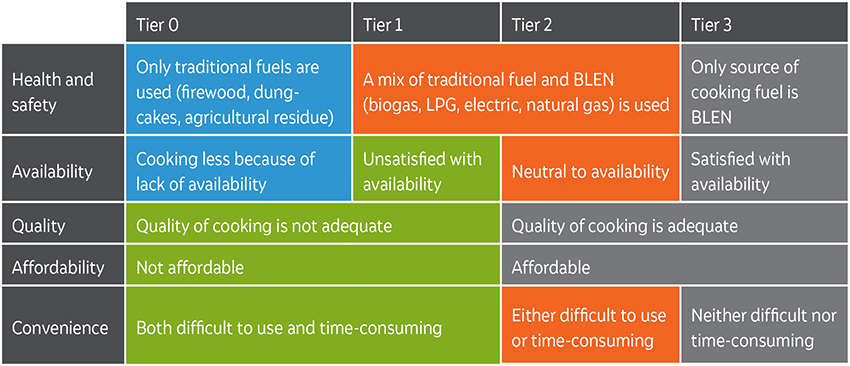
NOTE: For dimensions where the categories span multiple tiers, only the higher tier values apply. For example, households can only be ranked Tier 1 or Tier 3 for the quality and affordability dimensions, or Tier 0, Tier 2, or Tier 3 for the health and safety dimension.
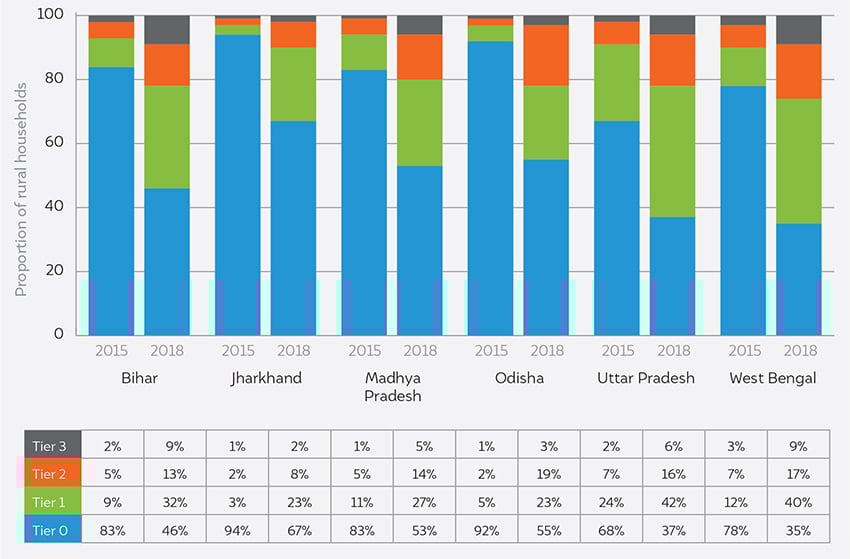
(Source: CEEW analysis, 2015)
On cooking energy:
In 2015, when a multidimensional framework to evaluate energy access in India was first used, it shed light on various aspects of energy access that are often overlooked in favour of simplistic measures such as the number of connections deployed. Many households that are connected to grid electricity or have LPG connections are satisfied with their energy access situation, but—despite having access to connections—many are not. The results of this study re-iterate why it is imperative to monitor multidimensional aspects of access to electrcity and cooking energy.
Dataset citation: Mani, Sunil; Shahidi, Tauseef; Patnaik, Sasmita; Jain, Abhishek; Tripathi, Saurabh; Ganesan, Karthik; Aklin, Michaël; Urpelainen, Johannes; Chindarkar, Namrata; Council on Energy, Environment and Water; Initiative for Sustainable Energy Policy; National University of Singapore. Access to Clean Cooking Energy and Electricity: Survey of States in India 2018 (ACCESS 2018)’.

Maximising Rooftop Solar Performance by Enabling a Robust O&M Ecosystem
What Drives Rooftop Solar Installation Decisions in Indian Homes?
Building a People-centric Energy Future:
Roadmap of the methodology to assess the climate co-benefits of the SUP ban in Tamil Nadu