Council on Energy, Environment and Water Integrated | International | Independent
Suggested citation: Biswas, Tirtha, Deepak Yadav, and Ashish Guhan. 2020. A Green Hydrogen Economy for India: Policy and Technology Imperatives to Lower Production Cost. New Delhi: Council on Energy, Environment and Water.
This paper estimates the hydrogen production costs for India through a spatio-temporal analysis of the production modes and cost of production of hydrogen from solar and wind energy till 2040. In the spatial analysis, it factors in 19 centres (including six metros) and the sectors of the economy (fertiliser, refineries, and iron and steel) that are likely to drive future demand for hydrogen. Further, the study considers baseline and optimistic scenarios in future projections. It determines the cost of hydrogen production in 2020, 2030 and 2040 in these two scenarios.
India can decarbonise its energy-intensive sectors such as industry, transport, and power by using green hydrogen. The likely surge in energy demand from these sectors during the post-pandemic economic recovery can be met by the production of hydrogen from renewable power sources, as renewable power is getting increasingly cheaper. Developed economies such as the European Union, Australia, and Japan have already drawn a hydrogen roadmap to achieve green economic growth. A hydrogen economy also improves air quality, mitigates carbon emissions, and fulfills the Atmanirbhar Bharat vision.
This paper proposes a hydrogen roadmap for India through a spatio-temporal analysis of the production modes and cost of production of hydrogen from solar and wind energy till 2040. In the spatial analysis, we factored in 19 centres (including six metros) and the sectors of the economy (fertiliser, refineries, and iron and steel) that are likely to drive future demand for hydrogen. We consider baseline and optimistic scenarios in future projections and determine the cost of hydrogen production in 2020 and that in 2030 and 2040 in these two scenarios. The cost of producing green hydrogen ranges from 3.6 to 5.8 USD/kg at present depending on the renewable energy mix. Our estimates show that by 2030, blue hydrogen production (for natural gas delivered at 6.3 USD/MMBtu) becomes competitive at locations with favourable wind and solar power. We also foresee, in an optimistic scenario, with all locations becoming competitive with blue hydrogen by 2030 and with grey hydrogen in 2040 provided electrolyser costs are drastically lowered (400 USD/kW by 2030 and 200 USD/kW by 2040) and storage costs also come down (<100 USD/kg by 2040).
In the short to medium-term, evacuation of the excess of electricity from renewable hydrogen plants can reduce the costs by up to 20 per cent. Drawing excess of electricity from renewable sources during peak renewable hours requires flexibility in the grid. The economic viability of laying large-scale pipelines to transport the hydrogen from renewable-rich production site to the far-off demand centre has to be clearly worked out. In the long term, we forecast the production cost difference between renewable-rich locations and demand centres to drop to 0.2–0.4 USD/ kg because of lower capital investment required for installing electrolyser and storage systems, allowing for the oversizing of equipment to offset renewable intermittency. Finally, achieving a low hydrogen production cost in the future crucially hinges on scaling up of global annual manufacturing capacities, which would drastically bring down equipment costs.
India has committed to reducing the emission intensity of economic activity by 33–35 per cent by 2030 (below the 2005 levels) under the Paris Agreement on climate change. To achieve this goal, the Government of India has drafted policies to reduce emissions from the power, industry, and transport sectors, which contribute a lion’s share of emissions to the economy. The targeted measures include an ambitious 450 GW of electric power generation through renewable energy sources by 2030, Perform, Achieve, and Trade (PAT) scheme for enhancing industrial energy efficiency, and increasing the share of electric vehicles (EVs) in both public and private transport. However, GHG emissions from the sector are still coupled with economic growth as fossil fuels cater to the majority of the energy demand. The World Energy Outlook 2018 estimated that India’s industrial and transport emissions, as a share of its total energy emissions, will rise from 37 per cent in 2017 to 50 per cent in 2040 (International Energy Agency [IEA] 2018).
Globally, green hydrogen, a source of clean energy and industrial feedstock, is now becoming the key focus of international climate agenda as the cumulative of all the Nationally Determined Contributions (NDC) fall way short of the required reductions in global GHG emissions needed to limit global warming below 2°C by the end of the century. The European Union (EU), Australia, and Japan have already announced their hydrogen roadmap and many countries are expected to draw up a hydrogen programme in the future. India is likely to witness a huge surge in energy demand in a post-pandemic world to realise rapid economic growth. To cater to the present energy demand, India imports petroleum and industrialgrade coal. The dependence on fuel import and vagaries of commodity markets could stifle growth. India is endowed with abundant renewable energy resources, but tariffs for power generated from these sources are falling. The hydrogen production technologies are fast evolving and expected to get cheaper due to a surge in global demand. For India’s energy transition to clean fuels, adoption of green hydrogen to generate energy would bring in significant benefits. The transition to a hydrogen economy will not only reduce India’s import dependency on hydrocarbon fuels but also provide clean air to its citizens and reduce GHG emissions in absolute terms.
We are of the view that India’s ambitious renewable capacity deployment targets accompanied by falling tariffs and the ever-increasing energy demand from the industry and transport sectors are ideal for making a switch to hydrogen economy. We evaluate the hydrogen production costs in different regions in India, primarily based on market forecasts and projections for various future scenarios. We identify the key conditions and technology targets that are required to support largescale and competitive production of hydrogen in the country. We finally recommend key policy measures that the government should implement for achieving competitive production costs in the future.
We model the production of green hydrogen as a linear optimisation problem in Python. We have used the model developed by Mallapragada et al. (2020) and adapted it to our specific process. The model includes all steps from the production of electricity in a solar photovoltaic (PV) plant and wind turbines till the supply of hydrogen to the consumer.
The operation of an electrolyser to produce hydrogen is based on the availability of renewable energy, which makes it necessary to include a hydrogen storage due to intermittence in the renewable energy production. The system is bound by two main constraints of law of conservation of energy and mass. The law of conservation of energy is used to constrain the AC power line and the law of conservation of mass is used to constrain the hydrogen line. The wind and solar power plants are connected to the AC power line, which is also connected to the AC/DC converter, compressor, and the electricity grid. Equation 1 shows the AC power line’s inflow and outflow of electricity:
The AC/DC converter supplies power to the electrolyser as DC power by converting the AC power from the AC line. The excess of power generated from the renewable sources is supplied to the grid if there is a capacity in the grid to absorb it, else it is curtailed.
Hydrogen production from the electrolyser occurs at a pressure of 30 bar and is connected to the hydrogen line, which is further connected to a hydrogen storage system. Hydrogen is stored at a pressure of 100 bar in the storage tank and is compressed using a compressor that consumes power from the AC power line.
The model’s input is a time series data of wind power and solar power availability in time steps of hours. The model is designed to produce a constant hydrogen supply throughout the time frame and the availability of system to supply hydrogen can be varied. The objective of the model is to minimise the total cost of the system that will be used to compute the least levelised cost of hydrogen (LCOH). Equation 2 defines the LCOH:
The output of the model is the sizing of the system components, its operation, and costs
Fig 1: Components and interaction of the optimisation model in our study
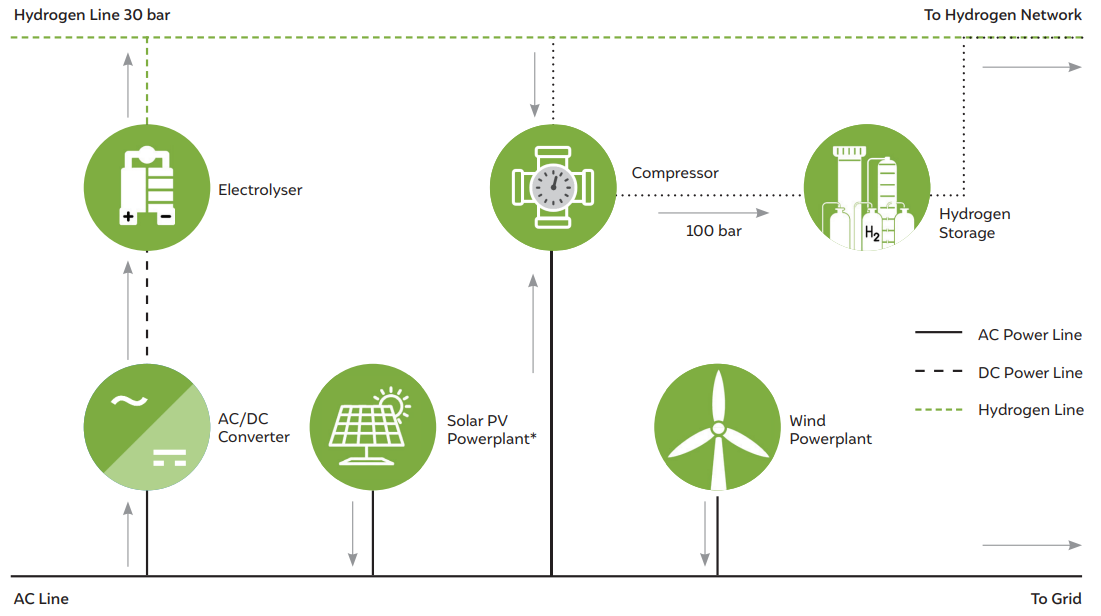
*Note: The output from a solar plant is in AC because of an inbuilt inverter
Source: Authors’ analysis
To determine the future demand nodes for hydrogen, we performed a spatial analysis. In our view, metro cities would be prominent demand centres for hydrogen mobility in the future. So, we chose six metro cities (New Delhi, Mumbai, Bengaluru, Chennai, Hyderabad, and Kolkata) in India for our analysis. In the industrial segment, we expect the fertiliser industry, refineries, and iron and steel plants to be the bulk consumers of green hydrogen in the future. The future industrial and transport demand nodes, along with the six metros, are identified in figure 2.
The load factor, which represents the annual availability of renewable power at the supply point, of solar and wind plants at the demand nodes are also shown in the Figure. We obtained the annual power generation profile for various locations from Renewables ninja (Pfenninger and Staffell, Renewable Ninja 2020), a website that allows the user to run simulations to determine hourly power output from solar and wind power plants anywhere in the world and is based on data published in the literature (Pfenninger and Staffell 2016) (Staffen and Pfenninger 2016). In Figure 2, we also identify renewable-rich areas near the demand nodes with good availability of wind resources. These solar and wind-resource rich areas near the demand nodes would become a possible supply point of large-scale cost-effective green hydrogen in the future. We presume that land and water are available at these locations and installing green hydrogen plants is not constrained by the lack of these resources.
Fig 2: Majority of the (future) demand centers have only access to solar resources
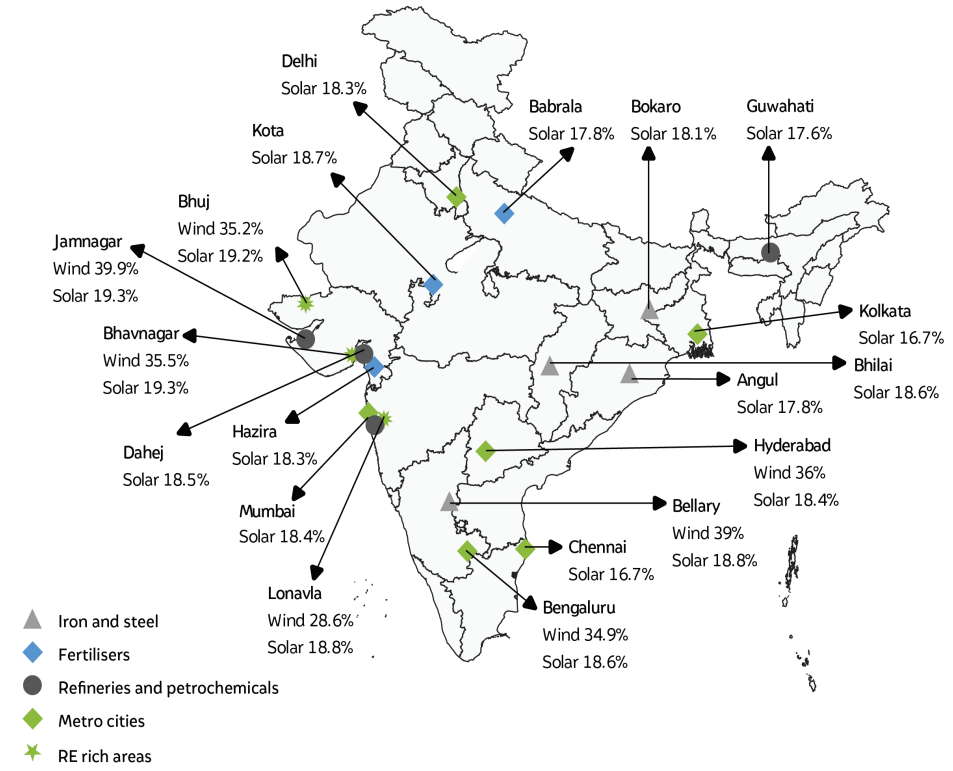
Note: Figures in percentages represent PLFs of renewable resources
Source: Authors’ analysis
Table 1 lists the cost, performance, and service life parameters of various components that we considered in our analysis. In our calculations, we consider costs and performance-related parameters at three time points: 2020, 2030, and 2040. We develop two scenarios (base case and an optimistic case) for future projections (2030 and 2040). In the base case, we assume an average value of the electrolyser cost and efficiency for the future scenarios. In the optimistic case, we assume that the electrolyser and storage costs are significantly lower and electrolyser efficiency to be higher. The corresponding parameters for the optimistic case are mentioned in parenthesis alongside the base case. In the optimistic case, we also consider the financing risks for hydrogen projects to be lower and developers can avail soft loans, which is reflected in the lower discount rate of 8 per cent in our calculations. The remaining parameters, especially those related to the costs of solar and wind systems, do not change on moving from the base case to the optimistic scenario.
Table 1: List of assumptions for the techno-economic analysis
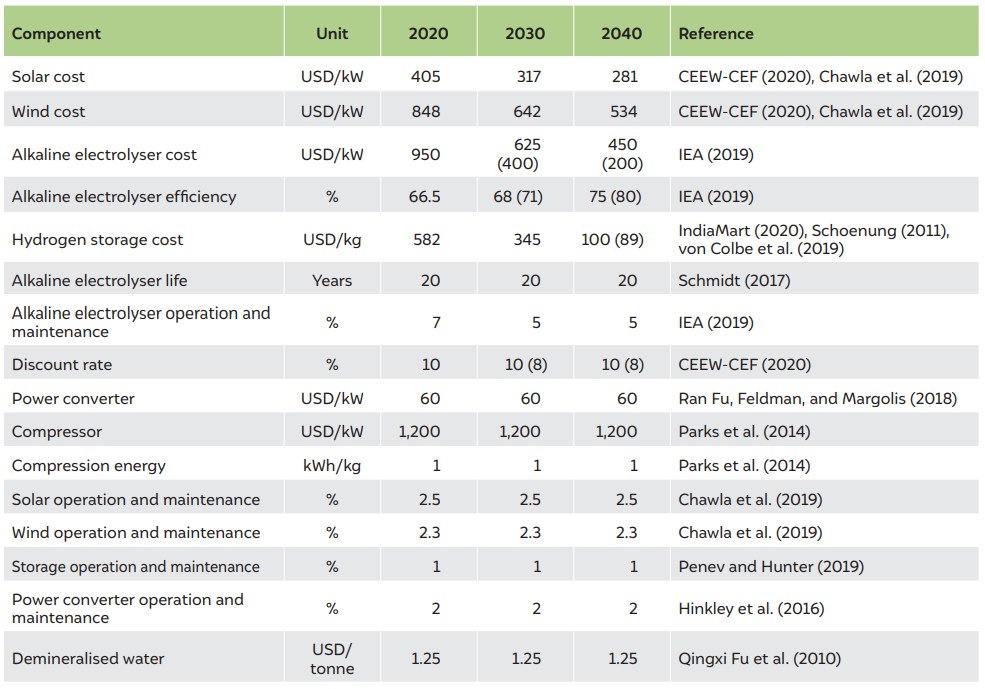
Note: USD = US dollar. The entire system life has been considered as 20 years. Additional costs of periodic replacement of components such as electrolyser stacks have been considered in the operating expenditure
Source: Author’s compilation from above mentioned references
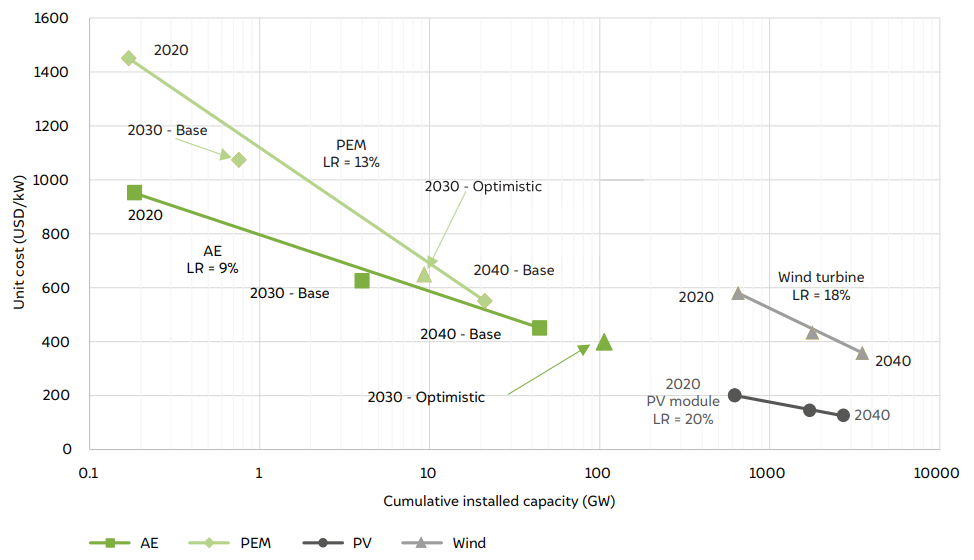
Figure 3 shows the projections of the unit cost of the electrolysers and renewable systems for 2030 and 2040. The average price of alkaline (AE) and polymer electrolyte membrane (PEM) electrolysers is taken from available data in the literature (IEA 2019). The cumulative installed capacities and learning rates of AE and PEM electrolysers are obtained from the report published by World Hydrogen Council (Hydrogen Council 2019). We then use the historical learning rates of electrolysers to estimate the cumulative installed capacity in the future that corresponds to the average prices in the 2040 base case. We also indicate the average and optimistic costs of electrolysers in 2030. For the 2040 optimistic cost target of 200 USD/kW (USD = US dollar), we rely on the bottom-up cost studies that relate the electrolyser cost with the annual production volumes (Mayyas, Mann and Garland 2018).
For renewable power systems, we break down the capital costs into module and turbine costs, the balance of plant costs, and miscellaneous charges such as land lease. We rely on the historical learning rates available in the literature ( International Renewable Energy Agency [IRENA] 2020) (Breyer, et al. 2017) and the current (REN21 2020) and modelled installed capacities in the future (IEA 2014) (IRENA 2019) to project the costs of solar modules and wind turbines in 2030 and 2040. We use India-specific learning rates to estimate the future prices of the balance of plant components in the solar and wind power systems (M.Elshurafa, et al. 2018). We also use India-specific data (Chawla, Aggarwal and Dutt 2019) for miscellaneous components such as land lease and other charges of solar and wind power plants. It may be noted that solar and wind prices are indicative only of the module and turbine costs. The total cost, inclusive of the balance of plant and miscellaneous components, is indicated in Table 1.
There exist studies that project the mid and long-term costs of solar and wind systems. IRENA expects the lower range for 2030 costs of solar and wind plants at 340 USD/kW (IRENA 2019) and 800 USD/kW (IRENA 2019), respectively. Our cost assumptions are lower than IRENA, possibly because we do not consider grid connection costs (transformer, sub-station and power evacuation costs). This is a valid assumption because the renewable hydrogen plant will be directly connected to the electrolyser and will not interact with the grid. The IRENA report does not mention costs for 2040. However, for 2050, IRENA expects the solar and wind costs to be 165-481 USD/kW and 650-1000 USD/kW, respectively. While our 2040 solar prices are within the range, the wind costs are lower than the range specified by IRENA (IRENA 2019). In addition, the IEA world energy model (IEA 2020) estimates for India indicates the PV costs at 350 USD/kW in 2040. For wind systems, the model considers only a marginal reduction from 1060 USD/kW in 2019 to 1020 USD/kW in 2040. However, in the absence of any detailed methodology and break-up for estimating the future cost trends in these reports, it is difficult for us to explain the differences. For technology development, we make conservative assumptions and do not consider any improvements in the efficiencies and consequently, the load factors of solar modules and wind turbines. This is in agreement with the results from the world energy model (IEA 2020) that expects a modest 1% increase in PLF of solar and 3% for onshore wind turbines.
We make use of the AE in all our analyses. This is because, as shown in Table 1, the AE is cheaper and efficient than PEM electrolysers. We have assumed that the alkaline electrolyser has the capacity to instantaneous ramp up and down. This is a valid assumption given that the literature review indicates that modern alkaline electrolysers can ramp up and down up to ±20 per cent of the rated capacity per second (IRENA 2018). Nevertheless, in the current analysis, we focus only on hourly simulation that does not capture transient phenomena like cloud cover and dip in wind speed. As compared to an AE, the PEM has the advantage of instantaneous ramping ability and might be more suited for an integration with renewable energy. Therefore, we also illustrate a case that compares the economics of producing hydrogen from alkaline electrolysers with that through PEM electrolysis.
The output of the linear program (LP) model is the sizing of the system components, its operation, and costs. The LP model typically oversizes the renewable energy source to ensure better full-load operating hours of the electrolyser. For consistency, we indicate the renewable oversizing relative to the electrolyser size as the renewable energy/alkaline electrolyser (RE/ AE) ratio. The hydrogen cost is obtained as a function of RE/AE. The production costs for a chosen location, Jamnagar, is provided in Chapter 5 (Results) in which a spatio-temporal analysis for the remaining locations is also presented.
Fig 3: Learning rates for electrolysers, solar modules, and wind turbines
Source: Authors’ analysis and International Renewable Energy Agency (IRENA). 2018. Hydrogen from Renewable Power: Technology Outlook for the Energy Transition. Abu Dhabi: International Renewable Energy Agency.
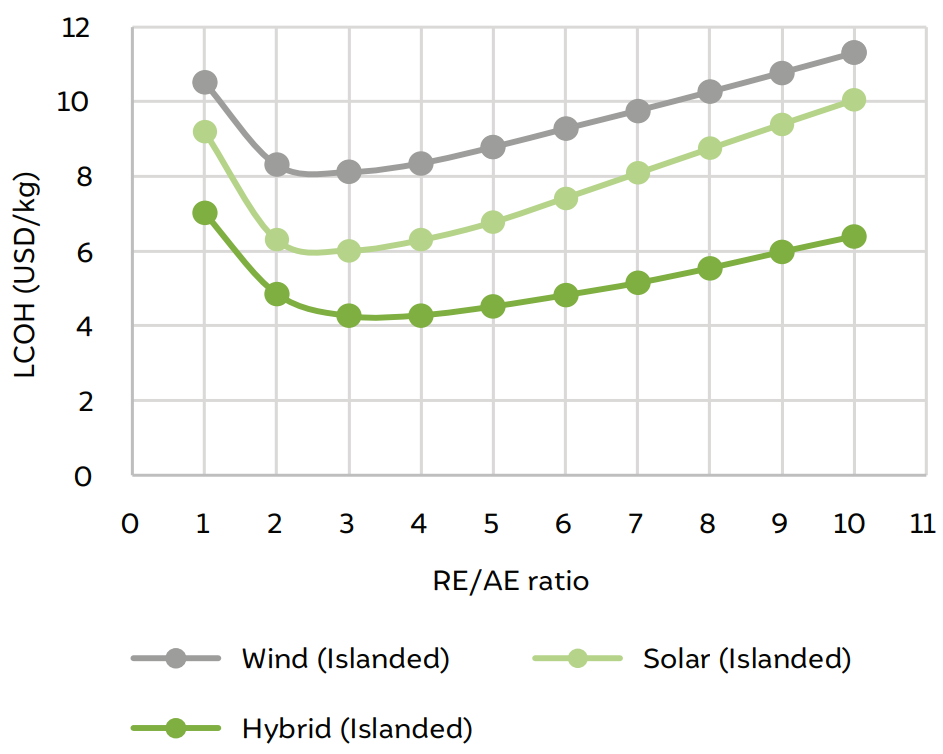
Figure 4 below shows the variation in the levelised cost of hydrogen (LCOH) for the varying renewable energy (RE) to alkaline electrolyser (AE) ratio at Jamnagar, Gujarat. We plot the results for 100 per cent wind, 100 per cent solar, and an optimised solar and wind energy mix. The graph depicts an islanded system where the excess renewable electricity is curtailed. In the case of Jamnagar, the optimal energy mix is obtained for an installed capacity share of 50 per cent wind and 50 per cent solar.
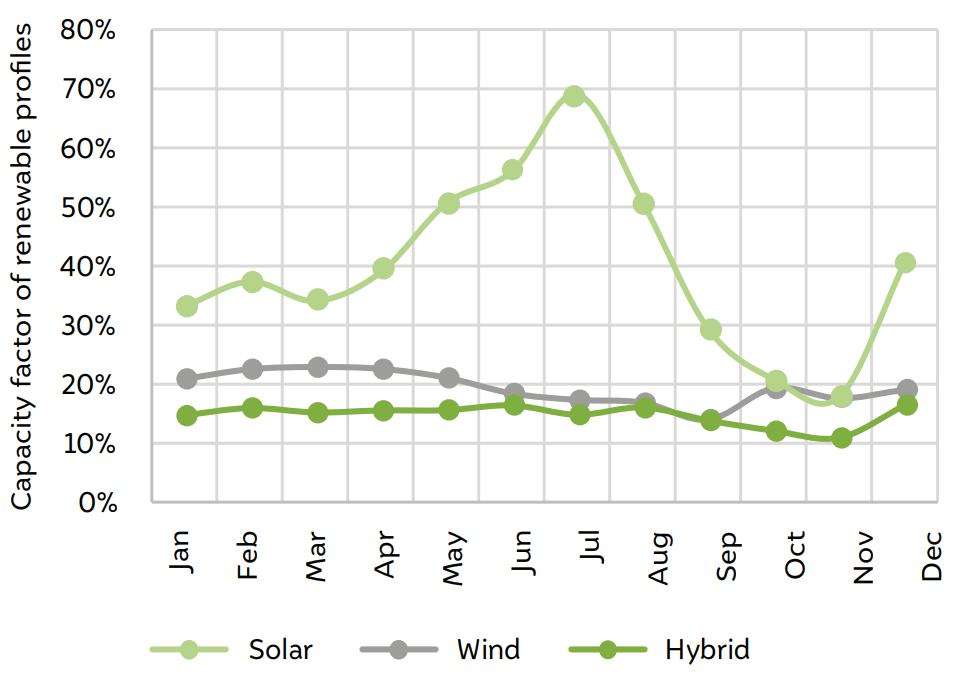
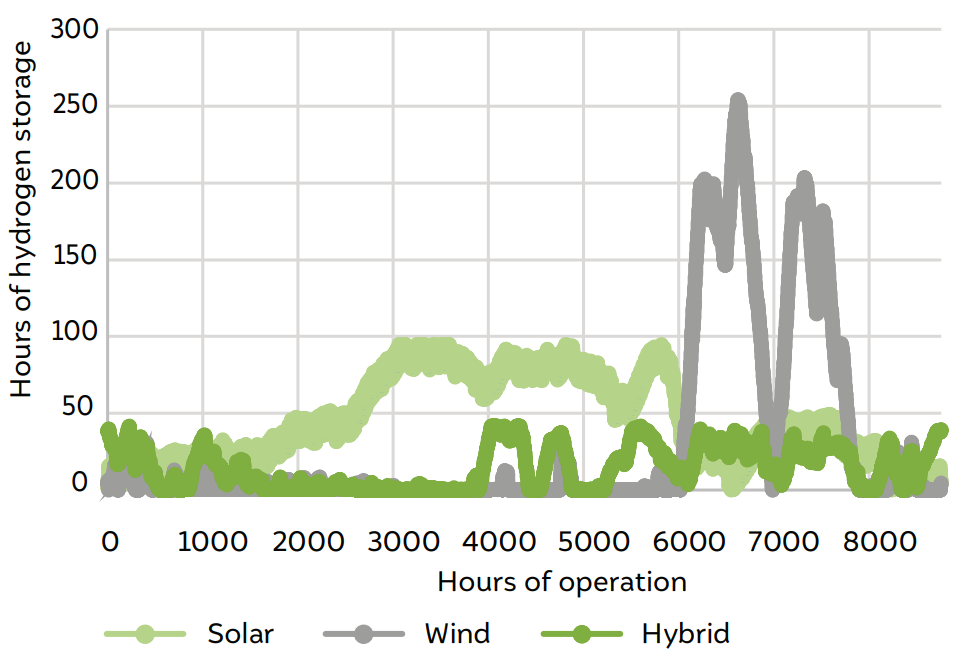
We observe that the hydrogen cost first reduces with increasing RE/AE ratio, reaches an optimum point, and then increases again at higher RE/AE ratios. We also find the costs to be higher for a wind-based system. This is because, as observed in Figure 5, hydrogen storage size increases as the availability of wind (for power generation) is seasonal. Solar power is also seasonal, but its magnitude of seasonal variation is lower compared to wind. Figure 6 shows the hydrogen storage profile for the solar, wind, and hybrid configurations. The storage size corresponds to the peak point in the storage profile. We see that the storage size for a wind-based hydrogen plant is more than twice that of the solarbased system. The hybrid configuration benefits from the complementary nature of solar and wind energy. The electrolyser is powered by wind energy when the solar availability is zero at night and vice versa. Therefore, for the hybrid configuration, the hydrogen storage size is less than half of the solar-based plant.
Fig 4: Variation in the hydrogen production cost with changing RE/AE ratio in Jamnagar, Gujarat
Source: Authors’ analysis
We model the hybrid configuration based on the share of installed capacities of solar and wind systems. But such an assumption does not lead to a proportional annual energy use. The model is designed to minimise the cost of producing hydrogen. Therefore, the share of solar and wind power in the energy mix varies on an hourly basis. For the hybrid system the annual share of solar in total electricity consumption is 40 per cent and the rest is obtained from wind. Primarily, the model maximises the use of solar power because it is cheaper and its seasonal variation is low. However, since the load factor of solar power is a limiting factor, wind energy is used to provide energy during night and lean solar times.
Fig 5: Variation in the load factors of solar, wind, and hybrid systems
Source: Authors’ analysis
Fig 6: Variation in the hydrogen storage size for solar, wind, and hybrid systems
Source: Authors’ analysis
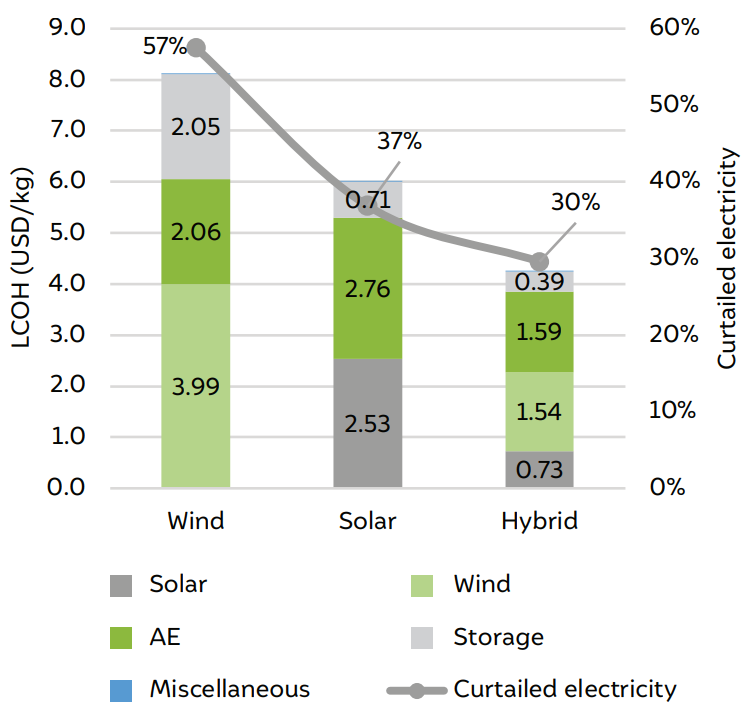
Figure 7 shows the distribution of costs for the three combinations considered in the study for Jamnagar, India. We indicate the distribution only at the optimum (minimum cost) points shown in Figure 4. As discussed earlier, the hydrogen storage cost is the maximum for the wind-based system. Since wind power is slightly expensive than solar power and also because it has higher curtailment due to seasonality, the energy costs are the highest for wind energy. Since the plant load factor (PLF) of a solar plant is less than 20 per cent, the electrolyser size increases compared to the wind-based system. Therefore, the electrolyser cost is the highest in the total cost of a solar-based system used for producing hydrogen. As expected, the cost of renewable power, electrolyser, and storage are the lowest for the hybrid configuration.
Fig 7: Distribution of the component costs for various configurations at the optimum points
Source: Authors’ analysis
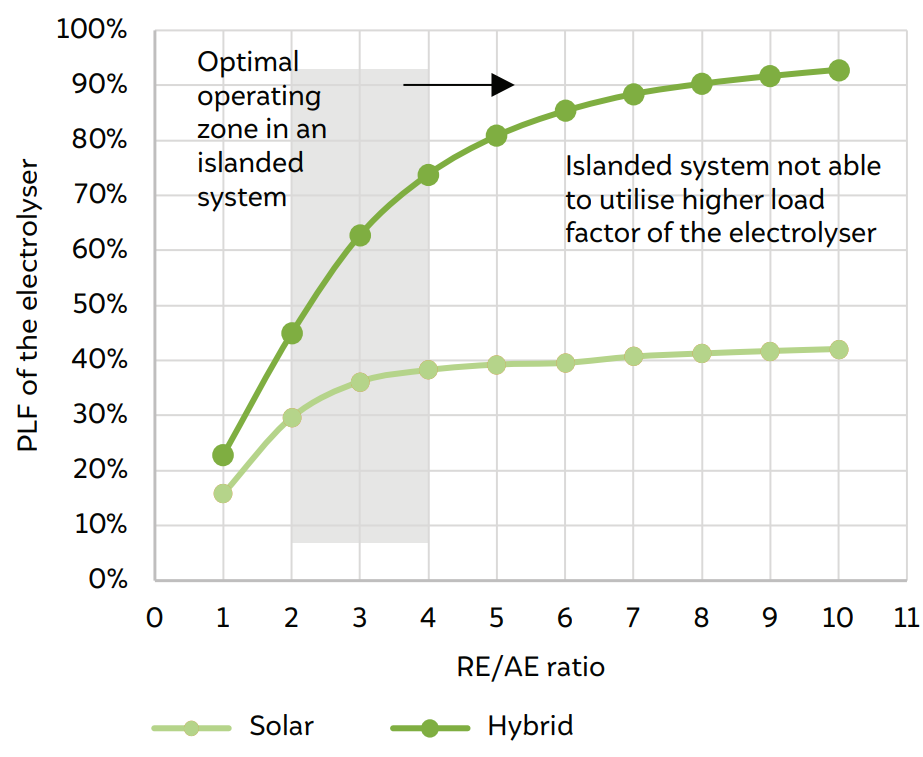
In the renewable hydrogen system, as shown in Figure 8, the load factor of the electrolyser rises with an increase in the RE/AE ratio. The increased load factor decreases the electrolyser and storage size. However, the amount of curtailed electricity as a percentage of the total renewable power also increases with an increase in the RE/AE ratio. At low RE/AE ratios, the primary driver for the decrease in LCOH are the reduction in the electrolyser and storage size due to increased load factor of the electrolyser. However, beyond the optimal point, any further increase in RE/AE ratio significantly increases the curtailed power, outweighing the possible benefits of the increased load factor of the electrolyser. Therefore, the islanded system does not fully realise the benefits arising from the increased load factor of the electrolyser. The curtailed power, at the optimum point, as a percentage of the total annual generation is shown in Figure 7.
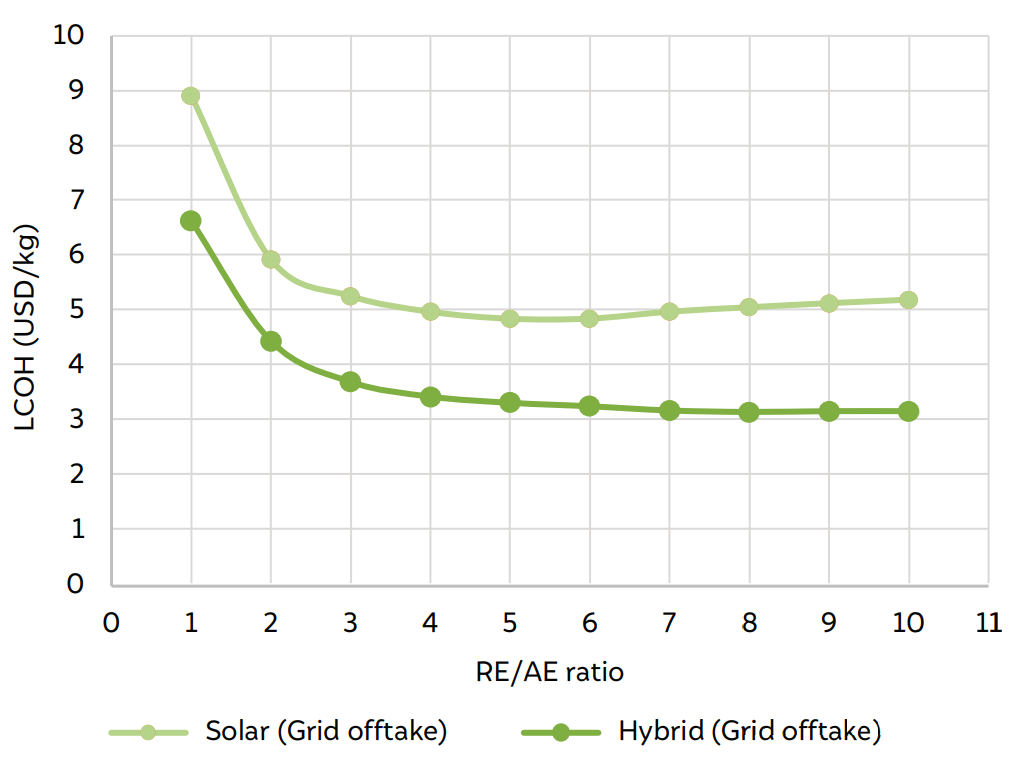
We now propose an alternative business model to further lower the hydrogen cost. In this model, we assume that the excess electricity generated by renewable energy is not curtailed but evacuated to the grid at the LCOE values. If this happens, the renewable hydrogen system would operate at a higher load factor without compromising on the hydrogen production costs. As shown in Figure 9, the increase in the load factor of the electrolyser proportionally reduces the hydrogen cost.
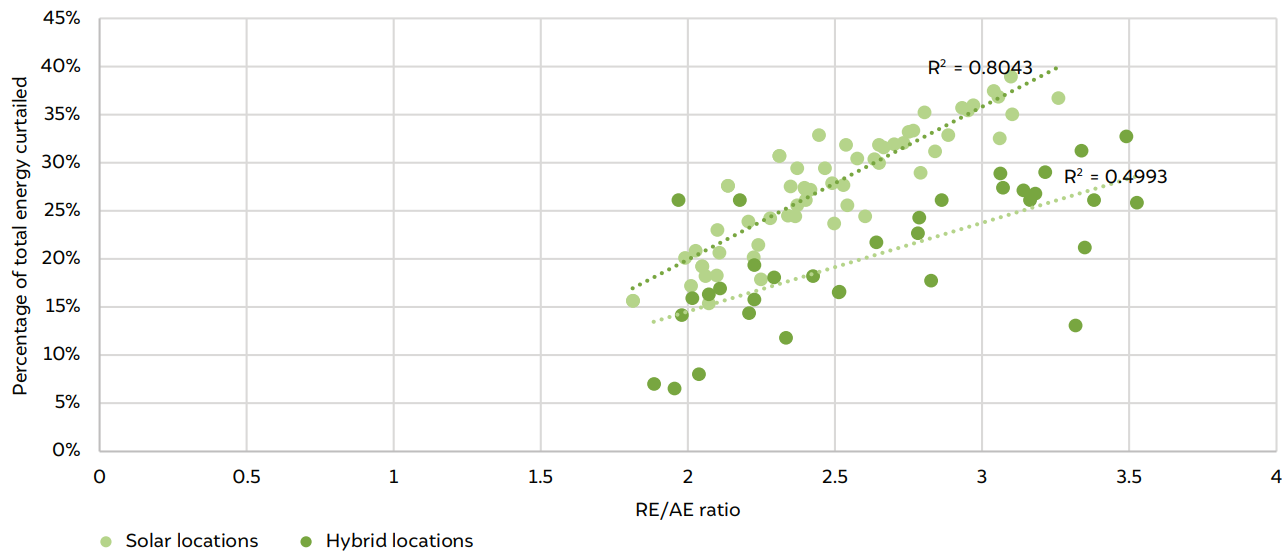
Figure 10 is a scatter plot of the percentage of curtailed electricity across various locations in India for the solarbased and hybrid hydrogen plants. In the plot, even though the scatter considers the temporal resolution, we differentiate them only based on the source of renewable energy. We find that for solar-based hydrogen plants, the curtailed energy is significantly higher than that in the hybrid plant. In India, there are a very few locations that have access to good solar and wind resources. Therefore, to enable a nation-wide transition to the hydrogen economy, the grid must evacuate excess electricity. Policies to support the evacuation of excess electricity is essential during the early phase of transition to the hydrogen economy.
Fig 8: Increase in RE/AE ratio increases the load factor of the electrolyser
Source: Authors’ analysis
Fig 9: Consumer buying the curtailed electricity significantly reduces the hydrogen costs
Source: Authors’ analysis
Fig 10: Percentage of curtailed electricity across various locations in India
Source: Authors’ analysis
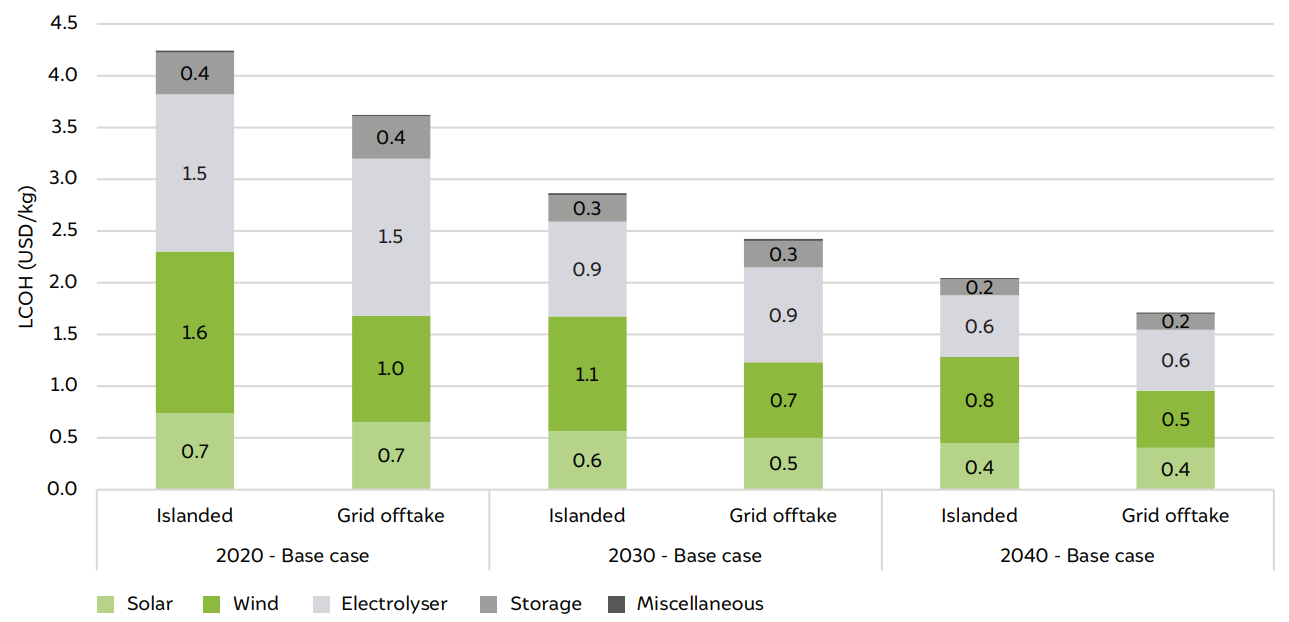
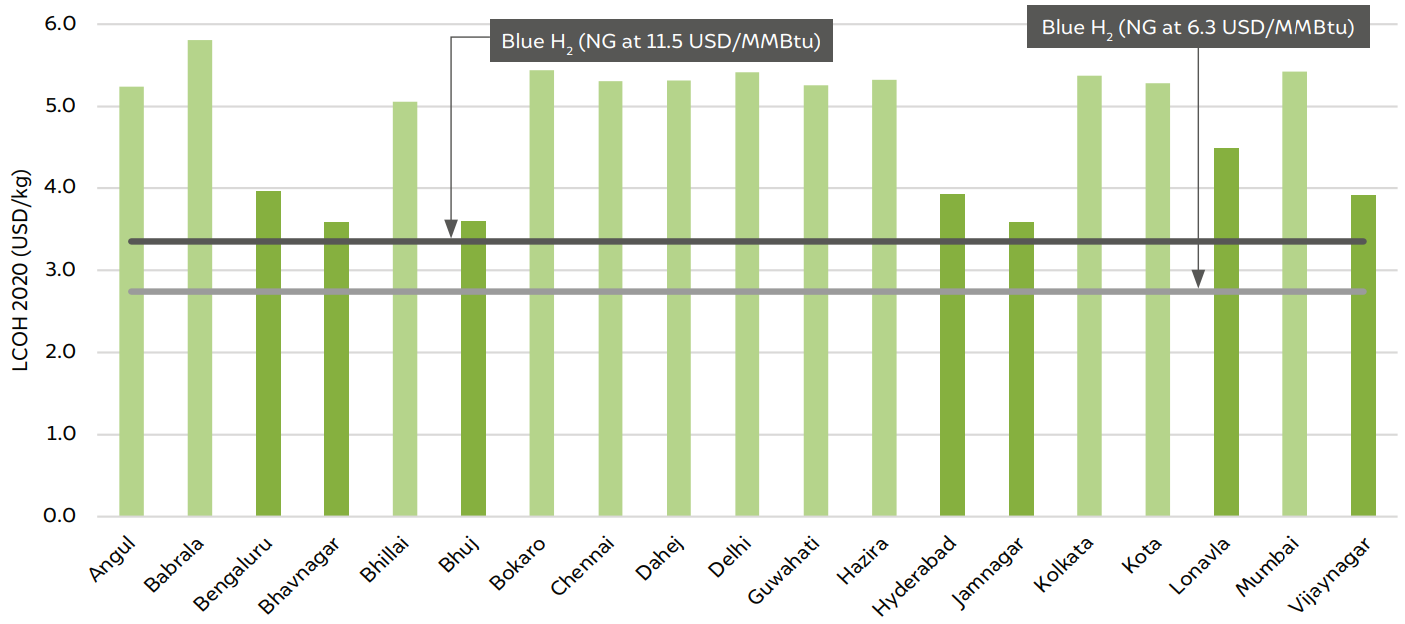
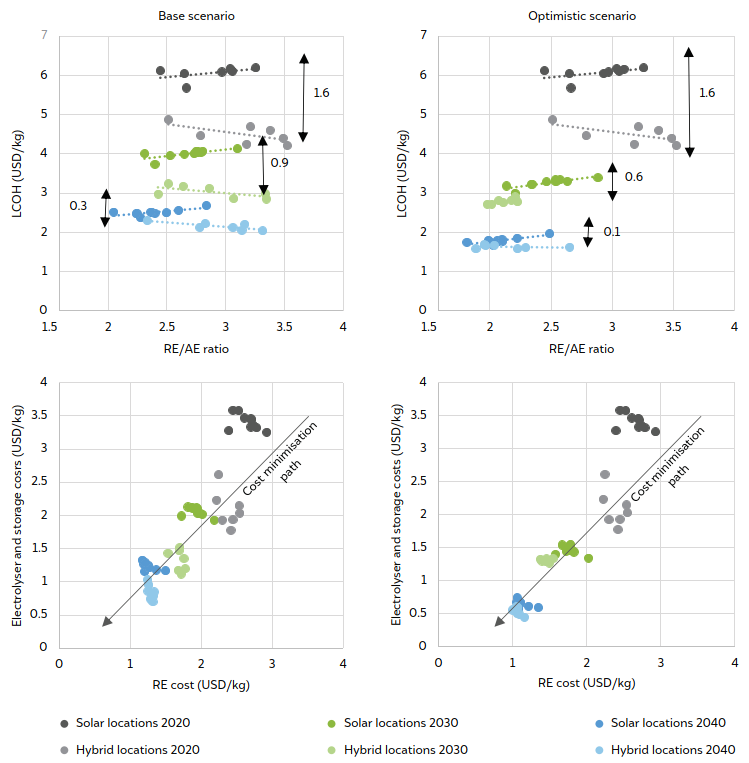
Figure 11 shows the expected variations in hydrogen production cost in the three time periods (considered in our study) for the base case scenario. The costs indicated for Jamnagar in Gujarat has a blend of solar and wind electricity. At the current state of RE and electrolyser technology, we expect the cost of green hydrogen to be 3.5–4.5 USD/kg. The costs are expected to slide down to 2.5–3 USD/kg in 2030. We expect hydrogen prices to drop further to 2 USD/kg in 2040. We see that across all configurations, the LCOH is lower for the case where there is a consumer offtake of excess electricity generated in the hydrogen plant.
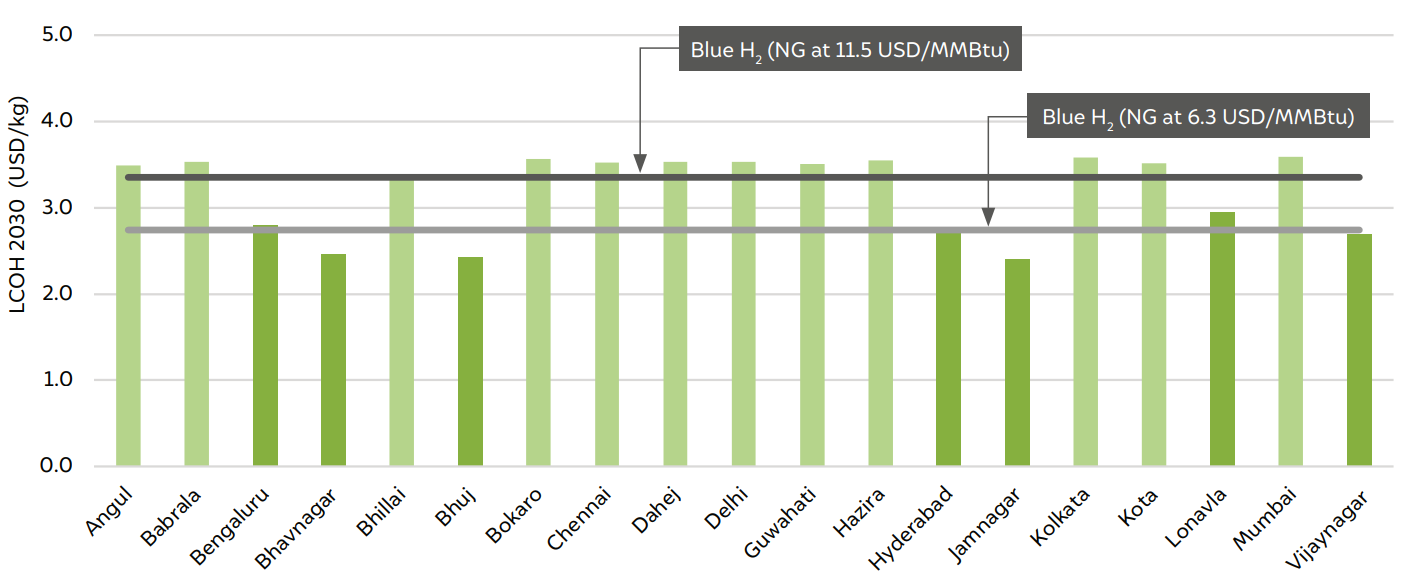
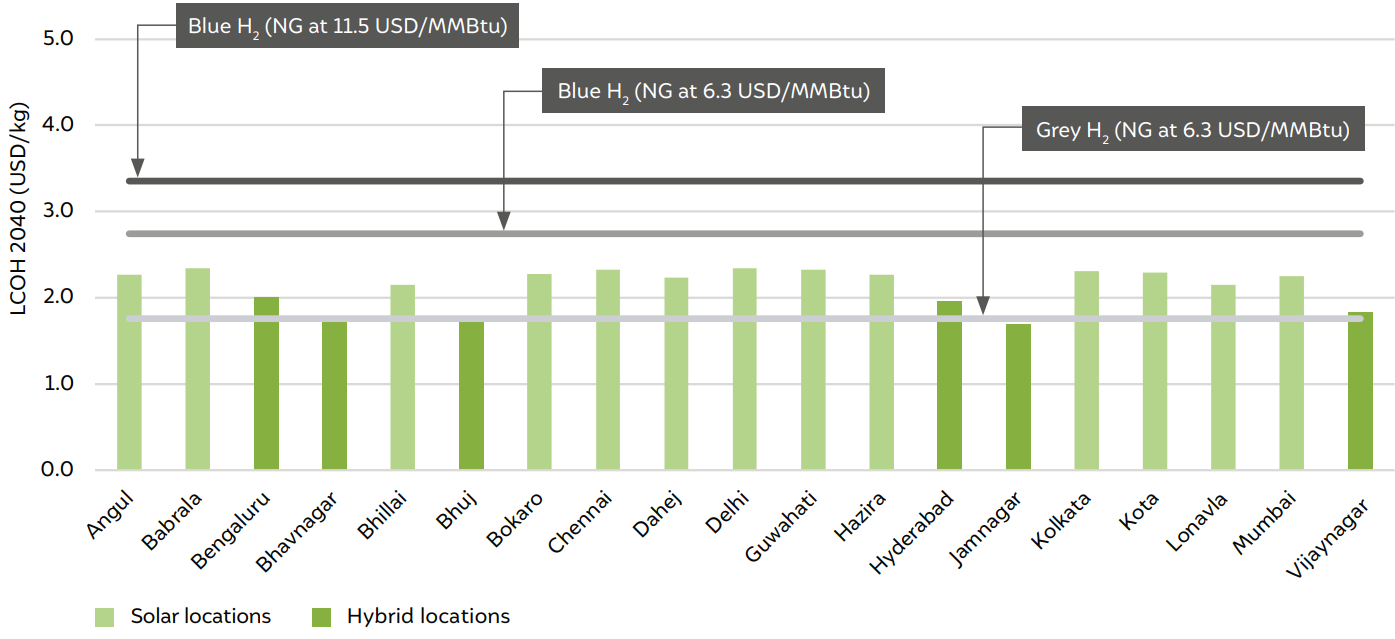
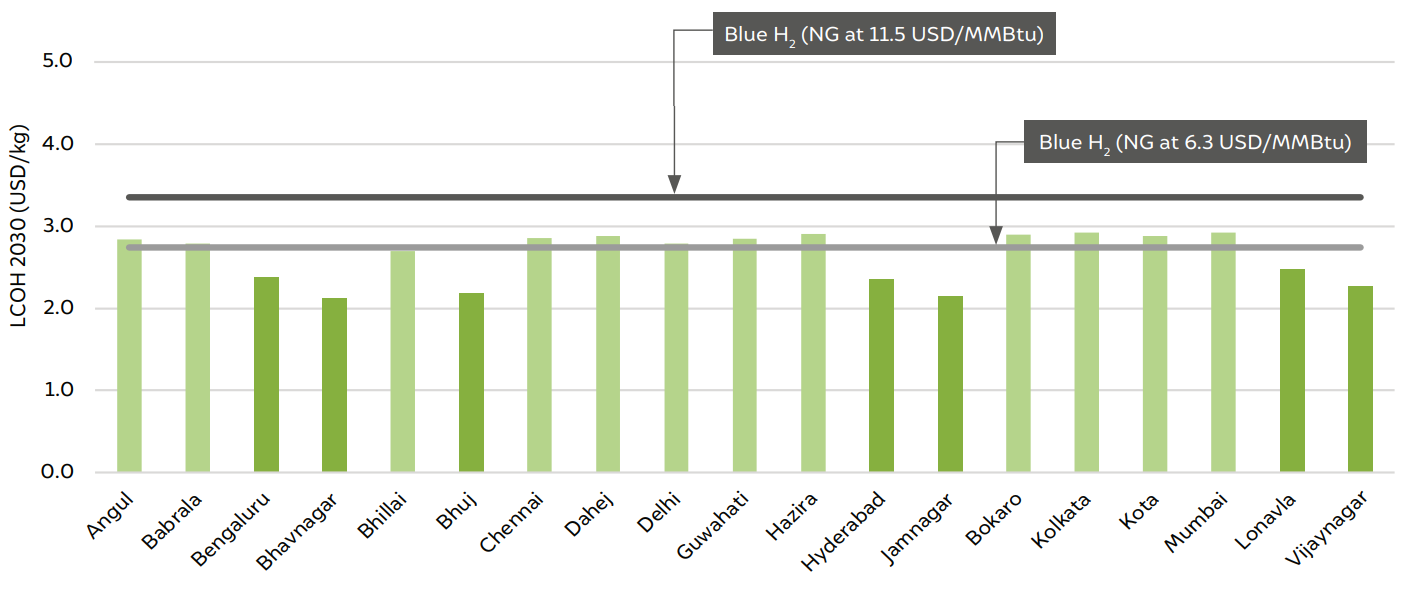
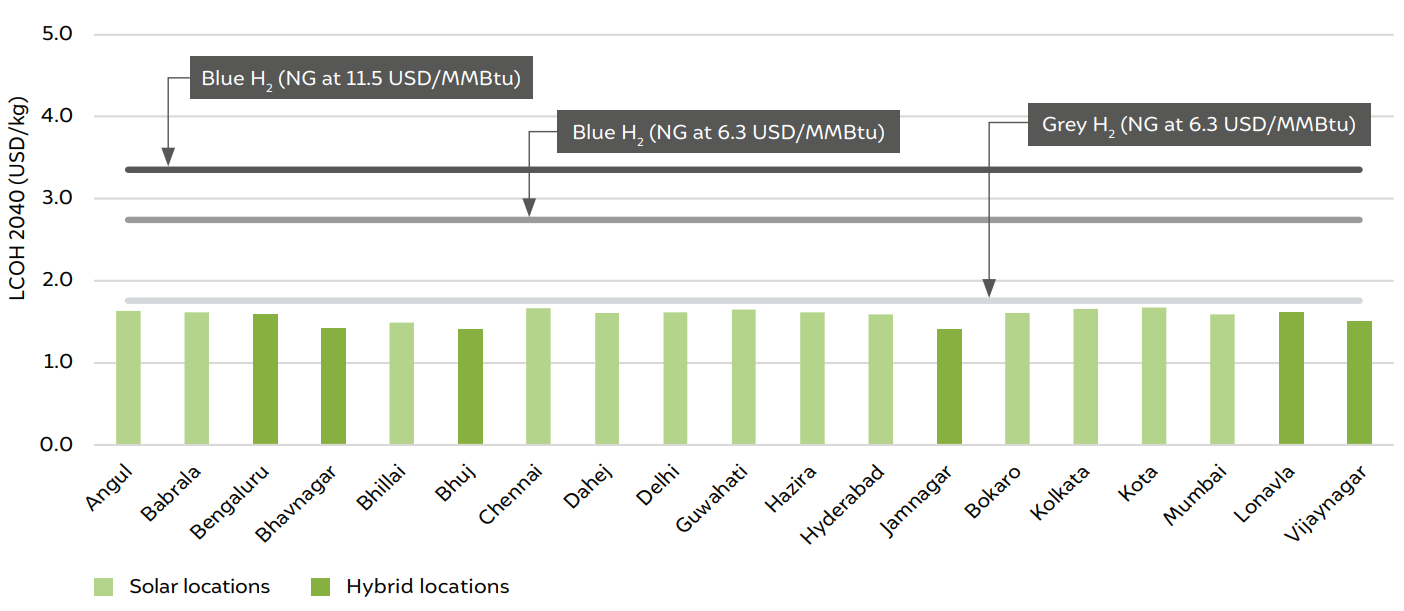
Figure 12 compares the production cost of green hydrogen (with grid offtake) across various locations in the three time periods considered in our study. In 2030, the estimated hydrogen production cost varies between 2.4 and 3.6 USD/kg of hydrogen and only 7 out of 19 locations are competitive with blue hydrogen (SMR + CCS) produced with a delivered natural gas price of 6.3 USD/MMBtu. However, in 2040, majority of the locations become competitive for producing blue hydrogen obtained with a delivered natural gas price of 6.3 USD/ MMBtu. The estimated long-term hydrogen costs for locations that have solar and wind resources drop below 2 USD/kg while the production cost in solar-only locations hovers around 2.1–2.3 USD/kg.
Fig 11: Variation in hydrogen production cost in all the scenarios for Jamnagar
Source: Authors’ analysis
In industries, hydrogen is used as a feedstock for producing ammonia or in refineries for desulfurising petroleum products. Steam methane reforming (SMR) is the conventional method (grey hydrogen) employed for industrial hydrogen production today. In India, the price of natural gas varies by the type of the industry. The fertiliser sector gets priority allotment of cheaper domestic gas, whereas other industries depend on liquefied natural gas (LNG) to meet their energy demand. While the historical wellhead price of natural gas to priority sectors range from 2.5 to 5 USD/MMBtu, the delivered price hovers between 3.6 and 8 USD/ MMBtu depending upon tax and pipeline tariffs. The Annual Survey of Industries database (Gupta, et al. 2019) indicates that the delivered price of natural gas to industries ranges from 9 to 14 USD/MMBtu. For our comparison, we assume an average delivered price of 6.3 USD/MMBtu for priority allocation and 11.5 USD/MMBtu for industries using LNG.
We rely on the literature to obtain the price of hydrogen as a function of the natural gas cost (Salkuyeh, A. Saville and L. MacLean 2017) (Randolph, et al. 2017) (IEAGHG 2017). We arrived at a hydrogen production cost in the range of 1.76 USD/kg when considering the priority sector allocation price (6.3 USD/MMBtu) and 2.37 USD/kg for tier 2 industries (based on the natural gas price of 11.5 USD/MMBtu). We also estimate the carbon abatement cost by assuming that the carbon dioxide produced during the SMR process is captured and stored. We use the data published in literature (Parkinson, et al. 2019) (IEAGHG 2017) (Abramson, McFarlane and Brown 2020) for estimating the cost of carbon capture and sequestration (CCS). We consider an average value of 78 USD/tonne of carbon dioxide for capture (including compression), 11 USD/tonne for transport and 13 USD/tonne for sequestration. Similarly, we take an average carbon intensity of 10.7 kg CO2 /kg of H2 for the SMR processes. Based on data available in the literature, we assume that about 90 per cent of carbon dioxide emitted during the reforming process is captured. Putting together all our assumed values, we expect an average carbon abatement cost for the SMR process to be ~ 1 USD/kg of H2 . Thus, with CCS, we expect the hydrogen cost to be 2.74 USD/kg for the priority sector and 3.35 USD/kg for industries using imported natural gas.
Source: Authors’ analysis
Fig 13: Comparison of LCOH for a grid offtake system across years in the optimistic scenario
Source: Authors’ analysis
A production cost of less than 3 USD/kg of H2 by 2030 and 2 USD/kg by 2040 across all locations can only be achieved in an optimistic scenario. In the optimistic scenario, we presume an aggressive price reduction in both electrolyser and storage technologies. The electrolyser cost is expected to reduce by nearly half to around 400 USD/kW by 2030 from the current price level of 950 USD/kW and projected to plummet a further 50 per cent from the 2030 prices to 200 USD/kW by 2040. According to the bottom-up manufacturing costs estimated by the National Renewable Energy Laboratory (NREL), the drastic fall in the electrolyser price is possible if the annual global electrolyser production capacity hits 5 GW by 2030 and 50 GW by 2040 (Mayyas, Mann and Garland 2018). The European Union’s Hydrogen Roadmap aims to achieve a 40 GW of electrolyser capacity by 2030 (European Commission 2020). If this target is achieved, the electrolyser prices would hit 200 USD/kW a decade earlier than projected in our study. But uncertainty will persist unless investments are made in commercial projects. To achieve a storage cost of less than 100 USD/kg of hydrogen by 2040, similar cost reduction measures need to be in place. Large pressure vessels are already commercial technologies and further aggressive cost reductions seem unlikely. While large-scale geological storage seems to be the focus for economies like the EU and Australia, India is yet to carry out an extensive analysis to map the prospective sites for storing hydrogen. Lack of low-cost storage solutions can become a potential barrier for the production of both green and blue hydrogen in India.
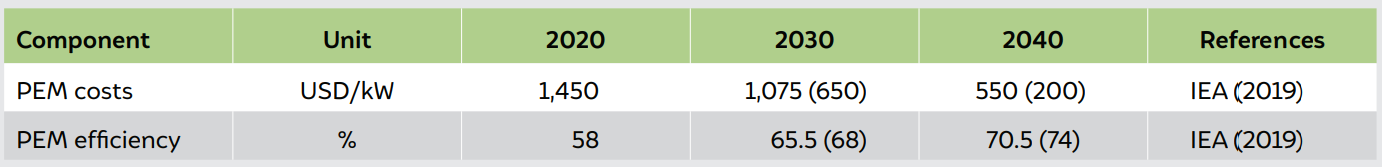
PEM electrolysers are found to be better suited for integration with variable renewable energy sources (solar and wind) due to their inherent ability to instantaneously ramp up and down. However, PEM electrolysers are more expensive and less efficient when compared to alkaline electrolysers. Here, we show a comparison of PEM and alkaline electrolysers by estimating the hydrogen production cost for Dahej, Gujarat. Table 2 summaries the cost and efficiency parameters of a PEM electrolyser considered for the comparative assessment. For the economic analysis with PEM electrolyser, we retain all other parameters indicated in Table 1.
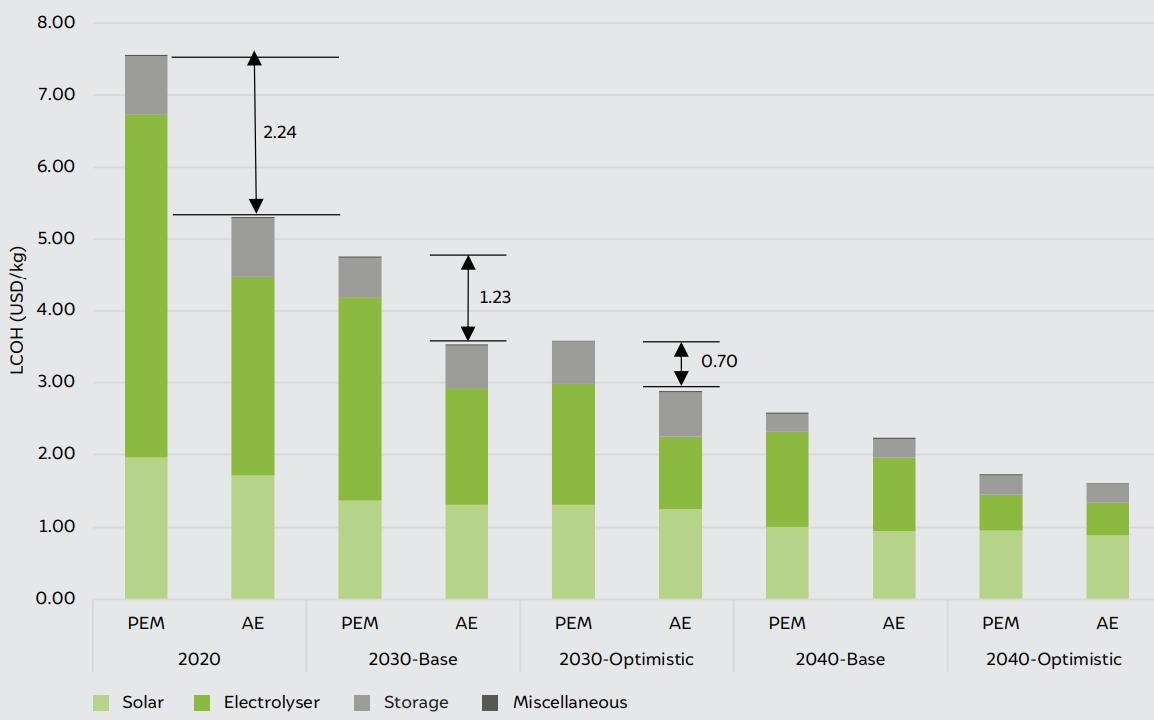
Figure 14 shows a comparison of hydrogen production costs from using PEM and AE for the various scenarios considered in the analysis. The comparison is made assuming that excess electricity is bought by the consumer at LCOE. We see a progressive reduction in cost on moving from 2020 to the next two decades. This is because, as shown in Figure 3, the cost of the PEM electrolyser is projected to drop at a faster rate than alkaline electrolysers. It is observed that for the optimistic scenarios, the cost difference between the alkaline electrolyser and PEM is less than the respective base case. We therefore feel that the market share of alkaline and PEM electrolysers would depend upon the ability of alkaline electrolysers to adapt to the varying nature of renewable power and the relative cost and efficiency improvements in the PEM electrolyser.
Table 2: Cost and efficiency parameters for the PEM electrolyser
Source: Authors’ analysis
Fig 14: Hydrogen obtained from the PEM electrolyser is expensive than alkaline electrolyser, but the difference is expected to decrease in the future
Source: Authors’ analysis
The present cost structure of hydrogen production for grid offtake model and at locations that have access to both wind and solar energy resources would be able to produce hydrogen at a lower cost. As already shown in Figure 5, the hydrogen plant enjoys a stable load factor when both solar and wind resources are available. At the 2020 prices, the difference in cost between the hybrid and solar-only hydrogen production is 1.57 USD/kg of hydrogen.
As indicated in Figure 15, the model follows a pathway that minimises both the renewable energy (RE) costs and the electrolyser and storage costs. In 2020, the solar only locations have both high RE costs (primarily because of high curtailment) and high electrolyser and storage costs. However, in the future scenarios, the spread of production costs from these locations reduces and converge along the line of minimisation path.
We expect an aggressive reduction in capital costs of electrolyser and storage in the future, which in turn would lead to a drastic drop in production costs in solar-only locations even if the electrolyser and storage sizes are relatively high when compared to the wind-and-solar locations. Further, as RE power gets cheaper going forward and with a decreasing RE/AE ratio, the contribution of curtailed electricity to the cost plummets significantly, thereby bringing down the overall production cost. In the baseline scenario, we estimate the average cost differential to be 0.97 USD/kg in 2030 and 0.36 USD/kg in 2040, respectively. If excess electricity is absorbed by the grid, the cost goes down further. We foresee a similar trend for the optimistic scenario as well.
Fig 15: The difference in production costs (islanded system) between the best renewable locations and demand centres significantly narrows down in the long term
Source: Authors’ analysis
The locations with renewable resources favourable for hydrogen production are at least 500 km or more away from most of the potential demand centres in India. Our cost estimates for transporting hydrogen through a steel pipeline are based on the US Department of Energy’s hydrogen delivery scenario analysis model (Brown, et al. 2019) at the 2020 prices. The transportation costs and material prices are unlikely to become cheaper in the future. Our evaluation shows that hydrogen can be economically transported from the wind and solar locations to demand centres (or solar locations) up to a distance of 1,000 km in 2040 only if large-scale pipelines are laid. The transportation cost of a largescale pipeline (having an energy flow rate similar to the Hazira–Vijaypur–Jagdishpur [HVJ] natural gas pipeline) is displayed in Figure 16. The HVJ pipeline is the largest pipeline in India with an energy capacity of 107 million standard cubic metres per day (MMSCMD). However, such high-volume pipelines would also require very high investments and needs a more detailed analysis to identify the optimal pipeline network capable of generating sustained revenues in the long run.
Fig 16: Comparison of pipeline transport costs with the production cost difference between solar and hybrid locations (islanded system)
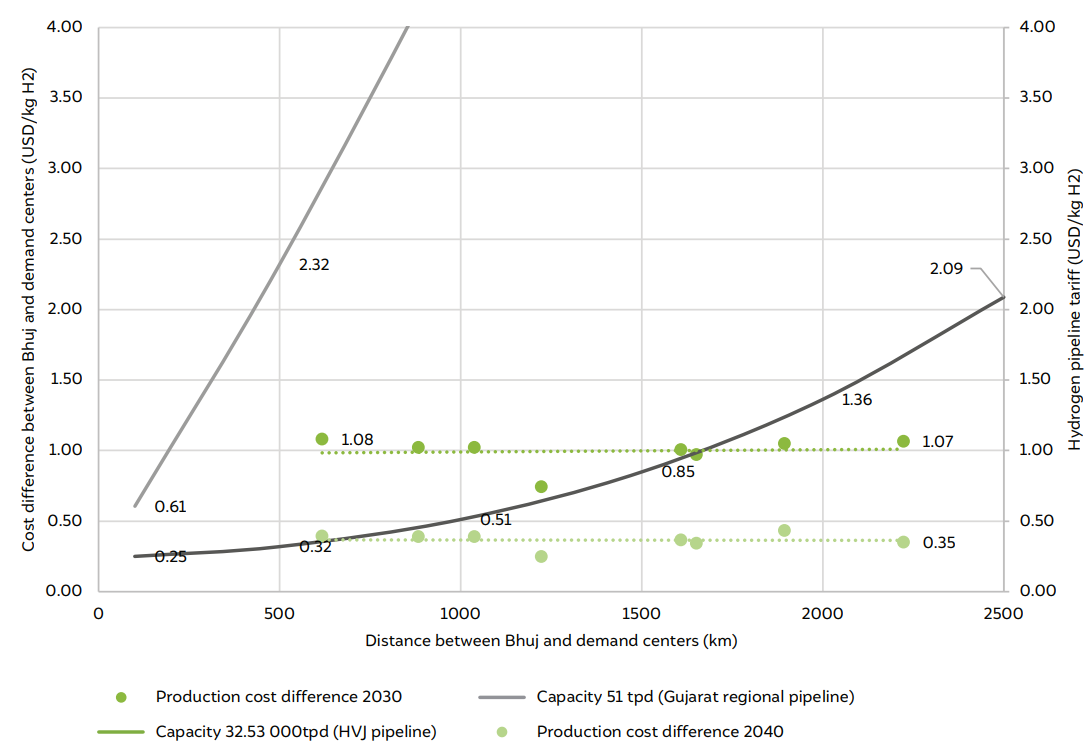
Bhuj has been considered as the reference for estimating the cost and LCOH difference across all solar locations
Source: Authors’ analysis using US Department of Energy’s hydrogen delivery scenario analysis model
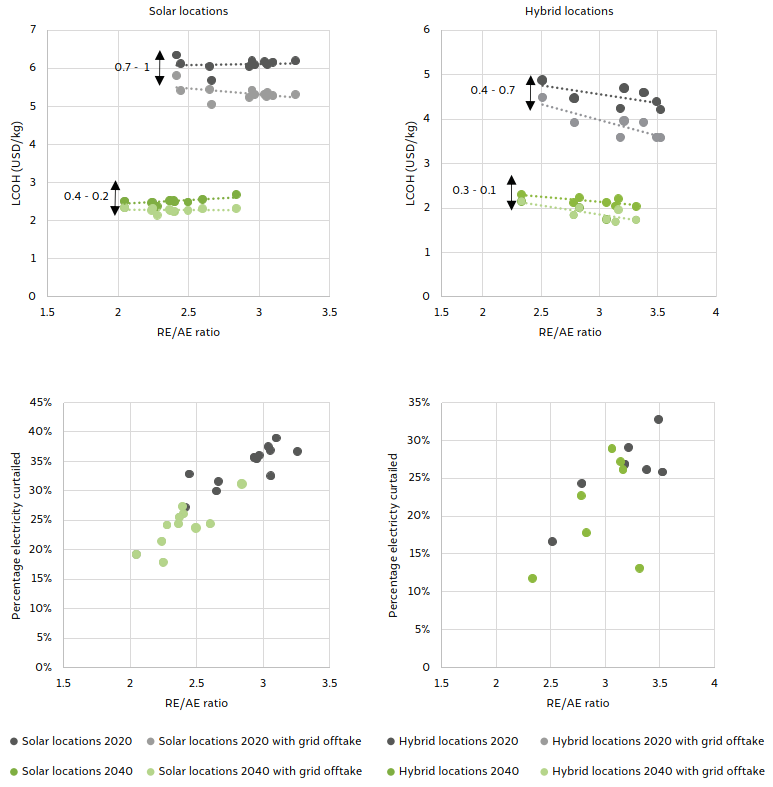
The islanded system can realise a significantly lower cost of production if the excess renewable electricity can be evacuated. In 2020, the share of excess electricity in total generation ranges between 26 and 39 per cent for the solar locations and between 17 and 33 per cent for the hybrid locations. The corresponding revenues earned from these plants ranges between 0.7 and 1 (solar) and 0.4 and 0.7 USD/kg of hydrogen (hybrid) (Figure 17). However, the excess of renewable power needs to be evacuated at peak renewable generation hours (noon for solar), which requires building additional flexibilities in the grid. The revenues earned from the electricity sales do not reflect grid integration costs.
However, the quantum of excess electricity and the corresponding revenues are likely to reduce in the future with reducing RE/AE ratios and LCOE prices of solar and wind (Figure 17). Our projected reduction in electrolyser and storage costs is likely to favour oversizing of the electrolyser and storage capacity and a reduction in RE installed capacity, thus decreasing the overall RE/AE ratio and excess electricity. The additional revenue from solar locations ranges between 0.19 and 0.44 USD/kg of hydrogen, while it varies between 0.15 and 0.35 USD/ kg of hydrogen for hybrid locations. Our estimates show that the additional revenue earned by selling excess electricity would reduce the total cost of production by 8–14 per cent in 2040.
Fig 17: Comparison of the additional revenues from the sale of excess electricity in 2020 and 2040
Only an aggressive price reduction (optimistic scenario) of electrolyser and storage technologies would pull down the hydrogen production cost to our projected 3 USD/kg of hydrogen by 2030 and 2 USD/kg of hydrogen by 2040 across all locations. In comparison, the cost of blue hydrogen (reforming of natural gas coupled with CCS) is 3.3 USD/kg for natural gas delivered at a price of 11.5 USD/kg and 2.7 USD/kg for a natural gas price of 6.3 USD/MMBtu. However, achieving a low cost of hydrogen production crucially hinges on policy support and strategic research priorities, which we list below:
I. Revenue from selling excess power to the grid can bring in significant economic benefits in the short-to-medium-term. However, as the production scales up, for the evacuation of excess electricity, additional flexibility needs to be built in the grid to absorb high amounts of electricity within a few hours of peak generation. For example, in Jamnagar, 17 and 5 kWh of excess electricity is likely to be generated per kg of hydrogen in 2020 and 2040 (optimistic scenario) respectively.
II. Achieving 80 per cent reduction in the capex costs for both electrolyser and storage technologies in the medium-to-long term has to be set as a target for less than 2 USD/kg production costs of hydrogen. Reducing the electrolyser costs would be possible only if the annual global production capacity of 50 GW is achieved by 2040. Therefore, a strong international commitment towards scaling up hydrogen economy is needed.
III. The cost of storage also plays a very critical role in reducing the overall production costs. While large-scale geological storage is the focus in economies such as the EU and Australia, India is yet to carry out an extensive analysis to map the prospective sites for storing hydrogen. Lack of low-cost storage solutions can become a potential barrier equally for both green and blue hydrogen production in India. Similarly, for pressure vessel storage, the current storage costs may drop down to 345 USD/kg by 2030, but a further cost reduction to 100 USD/kg can be achieved through commercialisation of alternate storage technologies like metal hydrides and liquid organic carriers (Schoenung 2011). We therefore recommend the Department of Science and Technology and academic research institutions to take up hydrogen storage as one of the strategic research priorities.
IV. The production cost advantage of generating hydrogen from blended solar and wind energy resources diminishes in the long run. Locations with favourable renewable resources having access to both wind and solar resources are at least 500 km away from the potential demand centres. An inter-state pipeline to carry hydrogen becomes economically viable only for very large-scale distribution volumes. We recommend a detailed evaluation of the infrastructure costs associated with the hydrogen distribution network for effective utilisation of natural gas assets.
V. Evolving technologies such as green-hydrogen-based-steel have a significant mitigation potential but also carry equally high risks arising from technology failures and other unknowns such as the ecological effect or geopolitical implications (Biswas, Ganesan and Ghosh 2019). Research and development (R&D) efforts would require industry, government, and academia collaboration often extending beyond the national boundaries.
How Secure is India’s Energy Future?
Unlocking the Potential for a Gas-Based Economy in India

Advancing India’s Green Steel Transition
CO₂ Pipeline Network for Carbon Capture and Storage in India
Bharat Cleantech Manufacturing Platform: Green Hydrogen Indigenisation Pathways