Council on Energy, Environment and Water Integrated | International | Independent
Suggested citation: Aggarwal, Prateek, Siddharth Goel, Tara Laan, Tarun Mehta, Aditya Pant, Swasti Raizada, Balasubramanian Viswanathan, Anjali Viswamohanan, Christopher Beaton, and Karthik Ganesan. 2022. Mapping India’s Energy Policy 2022: Aligning Support and Revenues with a Net-Zero Future. Winnipeg: International Institute for Sustainable Development.
This study, in collaboration with the International Institute for Sustainable Development, aims to improve transparency, create accountability and encourage a responsible shift away from fossil fuels and towards clean energy. The report provides an updated assessment of public resources that support fossil fuels, renewables, and electric vehicles.The study also explores the revenue implications of the energy transition and the need to diversify revenue sources, while investing fossil revenue strategically over this decade. Further, to ensure that the revenues are considered in the context of full costs, the study also estimates externalities associated with the various energy sources.
The previous reviews of India’s energy subsidies include — Mapping India’s Energy Subsidies 2021, Mapping India’s Energy Subsidies 2020, India’s Energy Transition 2018, and India’s Energy Transition 2017.
Energy is critical for many objectives of the Government of India, including economic recovery from COVID-19; universal access to clean and modern energy for human development imperatives; reducing severe levels of outdoor and indoor air pollution; and climate change mitigation. In 2021, at global climate negotiations, the government established a new commitment to reach net-zero greenhouse gas emissions by the year 2070. It also reaffirmed its aim to install 500 GW of non-fossil power capacity by 2030. This is up from 159 GW of non-fossil capacity as of February 2022 (Central Electricity Authority [CEA], 2022).
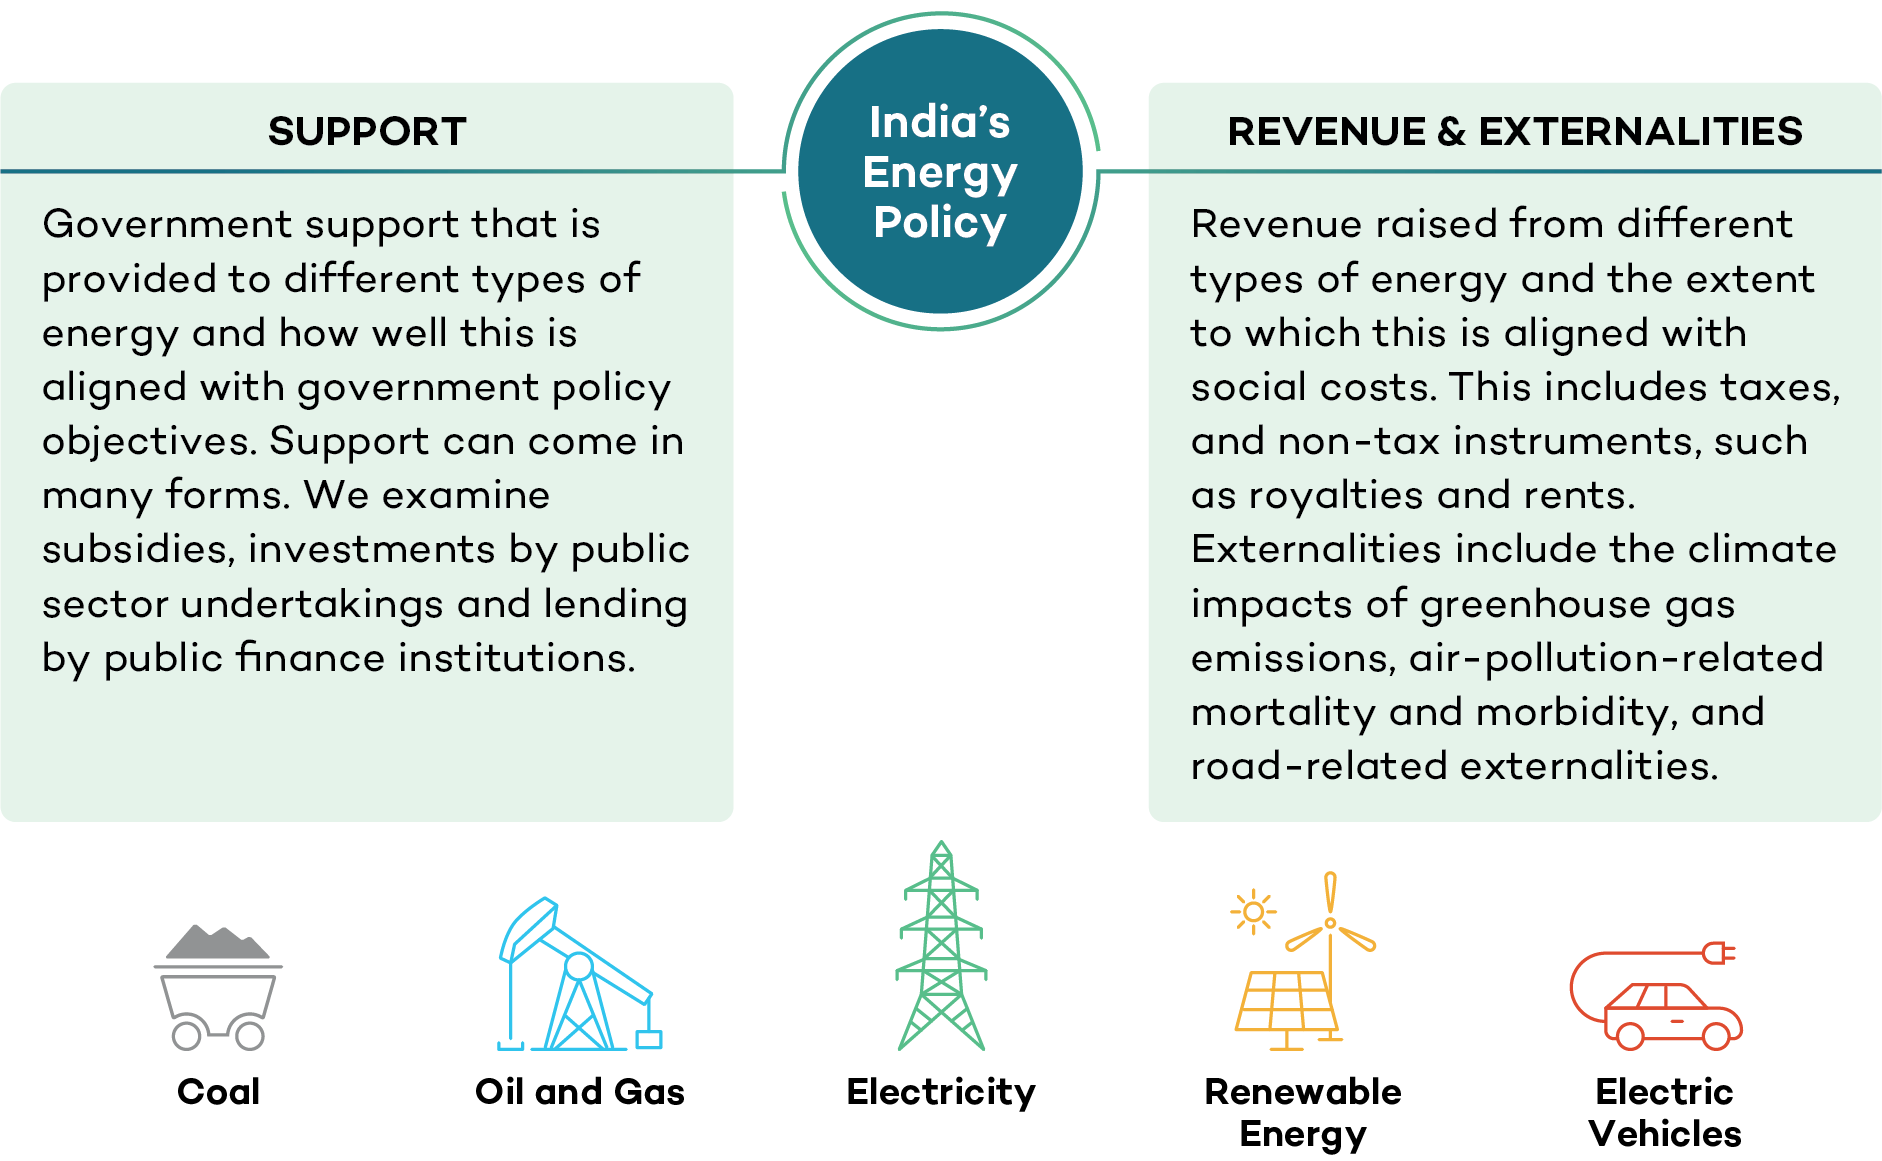
To support India’s ambitions, this report provides an updated assessment of public resources that support fossil fuels, renewables, and electric vehicles. We quantify trends in support levels in recent years and identify major areas where budgeting can be better aligned with stated policy objectives. Next, to explore the revenue implications of the energy transition, we identify the revenues raised from fossil and clean energy. To ensure that revenue benefits are considered in the context of full costs, we also estimate externalities associated with the various sources of energy that India relies on. This results in two key themes: “support” and “revenue and externalities,” as illustrated in Figure ES1.
The data for this study were collected from publicly available sources. On support, data are largely restricted to provisions by the Union government, reflecting data availability and what was feasible within project resources. On revenues, data cover Union, state, and Union Territory (UT) governments, reflecting good data availability. Where possible, we cover the full energy value chain: from production to consumption, including coal, oil and gas, electricity transmission and distribution (T&D), renewable energy, and electric vehicles (EVs). Nuclear power and hydropower are not included due to a lack of data. The underlying data are available online, and data on subsidies have been made easier to explore with an accompanying data portal.
Fig ES1: Framework used to assess India’s energy policy budgeting
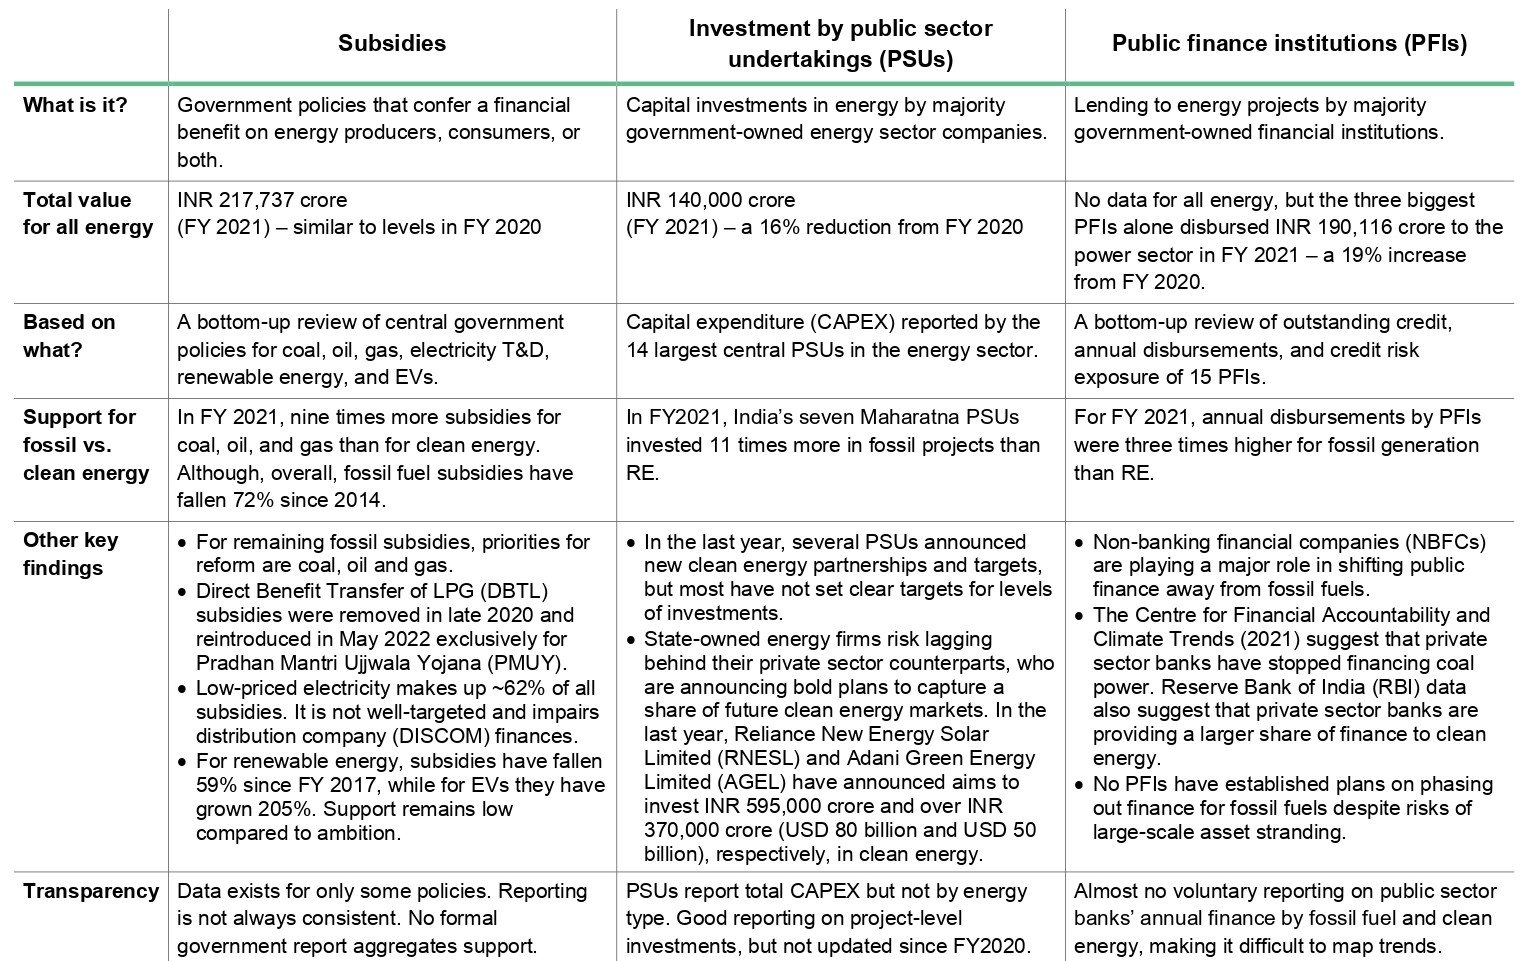
Large volumes of public support—over INR 540,000 crore (USD 77 billion)—flow to the energy sector every year. Table ES1 breaks this down by type of support. Shifting support away from fossil fuels and toward clean energy is a critical step on the path to net-zero.
Table ES1. Key findings on public support for energy
2. Energy-Related Revenues and Externalities
Energy is an important source of revenue for central and state governments. In FY 2020, the total energy revenue for the centre, states, and UTs was estimated to be INR 699,565 crore (USD 94 billion), around 17% of all government revenue. The majority of energy revenues (83%) are from oil and gas (see Figure ES2), with most coming from just two taxes: the central fuel excise and state-level VAT. Coal and electricity together comprise ~16% and renewables less than 1%.
Figure ES2. Revenues from key energy products and services (FY 2020)
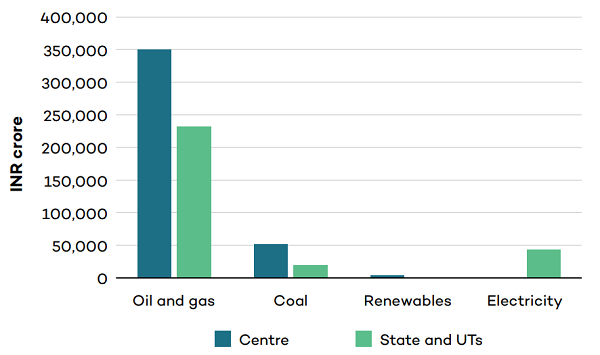
Source: Author’s calculations. See accompanying data sheets for details and underlying sources.
Note: Natural gas revenues were included with oil because they were not disaggregated in government budget sources.
In the medium term, revenues arising from fossil fuels will likely increase, largely because India’s oil product consumption is expected to grow considerably. However, significant volatility is associated with this revenue. Assuming the same average level of taxation as 2019, and considering consumption, production and price forecasts by the International Energy Agency (2021), we estimate fossil energy revenue could grow by an additional INR 30,000 to INR 340,000 crore (USD 4 to USD 48 billion) by 2030. The large range reflects the uncertainty in the pace of policy shifts to clean energy and how much progress is made toward India’s net-zero target. Beyond 2030, as fossil fuel use begins to peak and decline, revenues would ultimately fall significantly. This dynamic suggests the need to diversify revenue sources while investing revenue from fossil-fuel sources to augment the supply of clean energy and incentivize its demand. The synergy between social protection schemes and the consumption of clean energy must be factored in as the country deliberates a new investment paradigm.
Energy is not just a source of revenue, but also costs. Most benefits and costs are captured in market prices: sellers ensure costs of supply are covered, while consumers will only pay in proportion to the benefits they receive. Costs not captured in prices are considered “external” and should be acknowledged alongside public revenues. For FY 2020, we took a conservative approach (see Box ES 1) to illustrate this dynamic. For fossil fuels, we estimated externalities at between INR 1,441,464 crore (USD 203 billion) and INR 3,543,108 crore (USD 500 billion), up to five times revenues (Figure ES3). For solar photovoltaic (PV) and wind power, the quantified externalities totalled only INR 12,933 crore (USD 1.8 billion) to INR 17,872 crore (USD 2.5 billion), up to four times greater than revenues. This is a high- level assessment, but even so, it is enough to illustrate that the full costs of fossil energy far outweigh any revenue benefits. While no level of taxation would make critical externality costs acceptable, such as deaths and illness, the results do suggest scope for increasing taxation. This can help stimulate the transition efficiently, but it would also require stronger social protection systems to manage the impacts on the cost of living.
Figure ES3. Revenues and externalities from key energy sources (FY 2020)
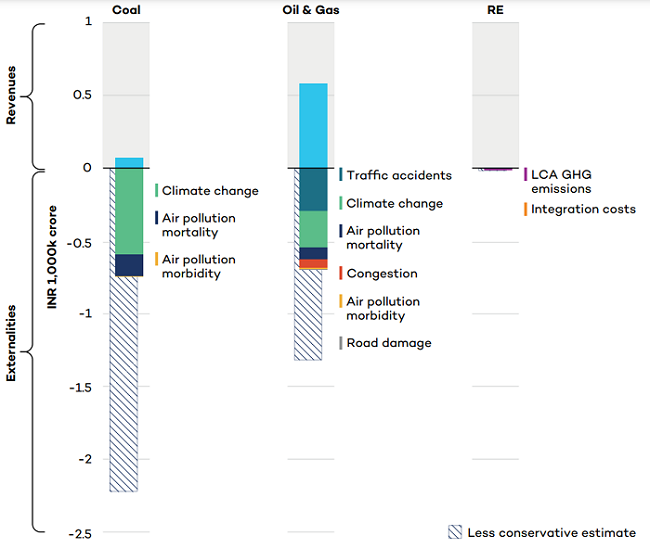
Notes: 1. Revenues include central, state, and UT revenues. 2. Externalities were calculated using India- specific sources where possible. See full report for details. 3. The “less-conservative estimate” is not considered to be an upper bound due to the large number of externalities that were not assessed, as summarized in the diagram. 4. Externalities not included: extraction and mining; land and water impacts; fugitive methane emissions; medical expenses; decommissioning and remediation; and biodiversity impacts.
There is considerable uncertainty inherent in the quantification of externalities. Our approach was conservative. Based on lower-end estimates from expert literature, we quantified only a limited number of external costs: morbidity and mortality from air pollution; an aggregate estimate of losses from climate change; losses from road damage, traffic accidents and congestion; and the costs of integrating renewables into the power system. To illustrate uncertainty, we also provide a higher estimate based on less-conservative but equally valid data.
Many negative externalities remain unquantified (see list in Figure ES3). Our assessment includes two externalities that often give rise to questions and warrant additional explanation. (1) Road damage, congestion, and traffic accidents are proportional to the amount driven, which is related to fuel consumption. Ideally, driving (including by EVs) would be taxed per kilometre of travel, with surcharges for congested areas, weight (road damage), and noise pollution. Until that is feasible, fuel prices should reflect these costs, and failure to do so creates an externality. (2) The variable and unpredictable nature of renewable electricity imposes costs (primarily for flexible generation and storage) that are typically not reflected in prices paid by consumers.
Maximising Rooftop Solar Performance by Enabling a Robust O&M Ecosystem
What Drives Rooftop Solar Installation Decisions in Indian Homes?

Building a People-centric Energy Future:
Roadmap of the methodology to assess the climate co-benefits of the SUP ban in Tamil Nadu