Council on Energy, Environment and Water Integrated | International | Independent
Suggested Citation: Malik, Aman, Vaibhav Chaturvedi, Medhavi Sandhani, Pallavi Das, Chetna Arora, Nishtha Singh, Ryna Yiyun Cui, Gokul Iyer, and Alicia Zha. 2023. Implications of an Emissions Trading Scheme for India’s Net-zero Strategy: A Modelling-based Assessment. New Delhi: Council on Energy, Environment and Water.
India’s emission trading scheme (ETS), dubbed the Carbon Credit and Trading Scheme (CCTS), passed into legislation last year. CCTS will be an extremely important policy instrument in the path to reach net zero in 2070 because it essentially incentivises industrial entities to reduce emissions. However, experience from other nations, particularly the EU, has shown that designing an effective ETS is a tricky and continuous process. This first-of-a-kind study investigates several crucial questions regarding the role of the ETS in meeting long-term mitigation targets, sectoral interactions under an emissions cap, and the ETS's compatibility with existing energy and climate policies. Using an integrated modelling framework, we provide key insights that will be useful for policymakers designing India’s ETS.
An ETS, or a cap-and-trade system, is a policy instrument designed to price carbon, thereby incentivising companies to reduce emissions. Jurisdictions managing an ETS limit or cap the total amount of GHG (greenhouse gas) emissions and liable entities within it must either reduce emissions from their production processes or continue emitting and pay for them by purchasing emission permits from a carbon market. Compared to other forms of regulatory policies to limit emissions, such as mandating emission reductions in a particular sector, specific entities, or through specific measures, carbon pricing is inherently cost-effective; i.e., reductions are achieved in the most flexible and least-cost way. For the same reason, governments worldwide increasingly use carbon pricing tailored to country-specific challenges, circumstances, and needs to achieve broader climate goals. As of 2023, 39 countries and 33 subnational jurisdictions have implemented some form of carbon pricing, covering 23% of global GHG emissions (The World Bank 2022).
The Government of India has planned to establish a Carbon Credit Trading Scheme (CCTS), a domestic emissions trading scheme (ETS) to help meet its near-term Nationally Determined Contributions (NDC) goals and long-term target of achieving net-zero emissions by 2070. This study aims to provide insights relevant to policymakers designing the Indian ETS. It does this by investigating the following questions:
We conduct this analysis by running four main scenarios using the integrated assessment model, Global Change Analysis Model v 6.0 (GCAM v6.0), adapted to India-specific assumptions and expectations. These scenarios are as follows: i) NZ (net zero); ii) NZ + ETS; iii) NZ + CC (command and control); and iv) NZ + RPO (renewable purchase obligations) + ETS. The NZ scenario assumes India’s near-term and long-term climate commitments, including achieving net zero by 2070. Scenarios with ETS (ii and iv) apply an emission cap on four sectors – electricity, iron and steel, cement, and fertilisers. The scenario with CC applies a homogenous emission cap on each of the chosen sectors, but it does not allow cross-sectoral trading. The last scenario considers renewable purchase obligations (RPOs along with an ETS).
We show that under a specific ETS emission cap:
As part of its commitment to the goals of the Paris Agreement, India pledged to reduce the emissions intensity of its GDP by 45 per cent by 2030, relative to 2005 levels, and increase the share of non-fossil capacity from 40 per cent to 50 per cent by 2030 (Press Information Bureau 2022). Additionally, India announced a long-term target of reducing emissions to net zero by 2070 (Press Information Bureau 2022).
To achieve its stated decarbonisation targets, India has already deployed a slew of energy policies across sectors. Promoting renewable energy (RE) in the power generation sector is a critical part of the strategy, given the sector’s significant share in India’s emissions. Policies to support this objective include guaranteed feed-in tariffs, accelerated depreciation of wind and solar assets, creation of green energy transmission corridors for evacuating RE from RE-rich states, creation of solar parks and ultra-mega electricity projects, and, most importantly, implementation of renewable purchase obligations (RPOs) (Climate Policy Database 2023). Distributed RE is also a key element in the strategy, with a focus on both rooftop solar as well as solar pumps. More recently, the attention has been on policies aimed at increasing the share of domestic manufacturing in the RE value chain through a Production Linked Incentive (PLI) scheme (Ministry of Commerce & Industry 2021).
Energy policies targeting other energy-intensive industrial sectors include the market-based Perform Achieve and Trade (PAT) scheme, which is specifically aimed at improving the energy efficiency of industrial units. Within the transport sector, the Faster Adoption and Manufacturing of (Hybrid &) Electric Vehicles in India (FAME) scheme incentivises the adoption of electric vehicles (Ministry of Heavy Industries 2020). Additionally, non-fiscal policies have also been devised to help establish a supportive ecosystem of charging infrastructure across the country. Within the residential and commercial building sector, higher penetration of energy-efficient appliances has been achieved through the Standards and Labelling programme of the Bureau of Energy Efficiency (BEE, Government of India). Efforts are also being made to enhance energy efficiency in buildings efficiencies in line with the Energy Conservation Building Codes (ECBC) guidelines. Recently, in January 2022, the Government of India initiated the Green Hydrogen Mission to significantly increase hydrogen production and bring down production costs (Ministry of New and Renewable Energy 2023).
In addition to all the existing policies, an amendment to the Energy Conservation Act, 2001 was passed in December 2022, following approval by both houses of parliament, paving the way to add another important policy instrument for emissions reduction to the existing matrix – a domestic emissions trading scheme (ETS), called the Carbon Credit Trading Scheme (CCTS) (Press Information Bureau 2023). It is proposed that after the first transition period (2023–25), the second phase (from 2026 onwards) will include a fully functional ETS, consisting of sectors and entities that are already part of the PAT scheme, which will be given a GHG emissions intensity target (tCO2 e/t product) (Singh and Chaturvedi 2023). The unique feature of this policy instrument is that, for the first time, a policy instrument in India will directly target carbon dioxide emissions compared to other energy policies, which target either energy efficiency or fuel switching. Essentially, an ETS puts a price on the carbon emitted by entities.
Carbon pricing is a policy instrument that aims to reduce carbon emissions by placing a cost on carbon. Carbon pricing could be through a carbon tax, an ETS, or a mixture of the two (hybrid policy) (Figure 1). An ETS can place an absolute cap on the total volume of GHG emissions produced by one or more economic sectors in a jurisdiction (such as the EU ETS, Korea ETS, California Cap-and-Trade, etc.), or it can be an output-based cap using emission intensity targets (i.e., emissions per unit of electricity generated or product, such as in the China and Indonesia ETSs and starting in 2026 for India). Depending on the overall cap-setting approach, the entities in the covered sectors are allotted emission allowances, either through free allocation (e.g., using emissions intensity benchmarks), auctions conducted by the state authority, or a combination of both. Depending upon their ability and the costs of reducing emissions, entities can then trade emission allowances. Entities with emission intensities lower than a predefined benchmark can sell credits to entities with higher emission intensities. This results in a process of price discovery per tonne of carbon. Carbon can also be priced through a uniform carbon tax, wherein the government levies a set fee on the GHG emissions from certain sectors, providing a price incentive to reduce emissions.
Figure 1 Different forms of carbon pricing
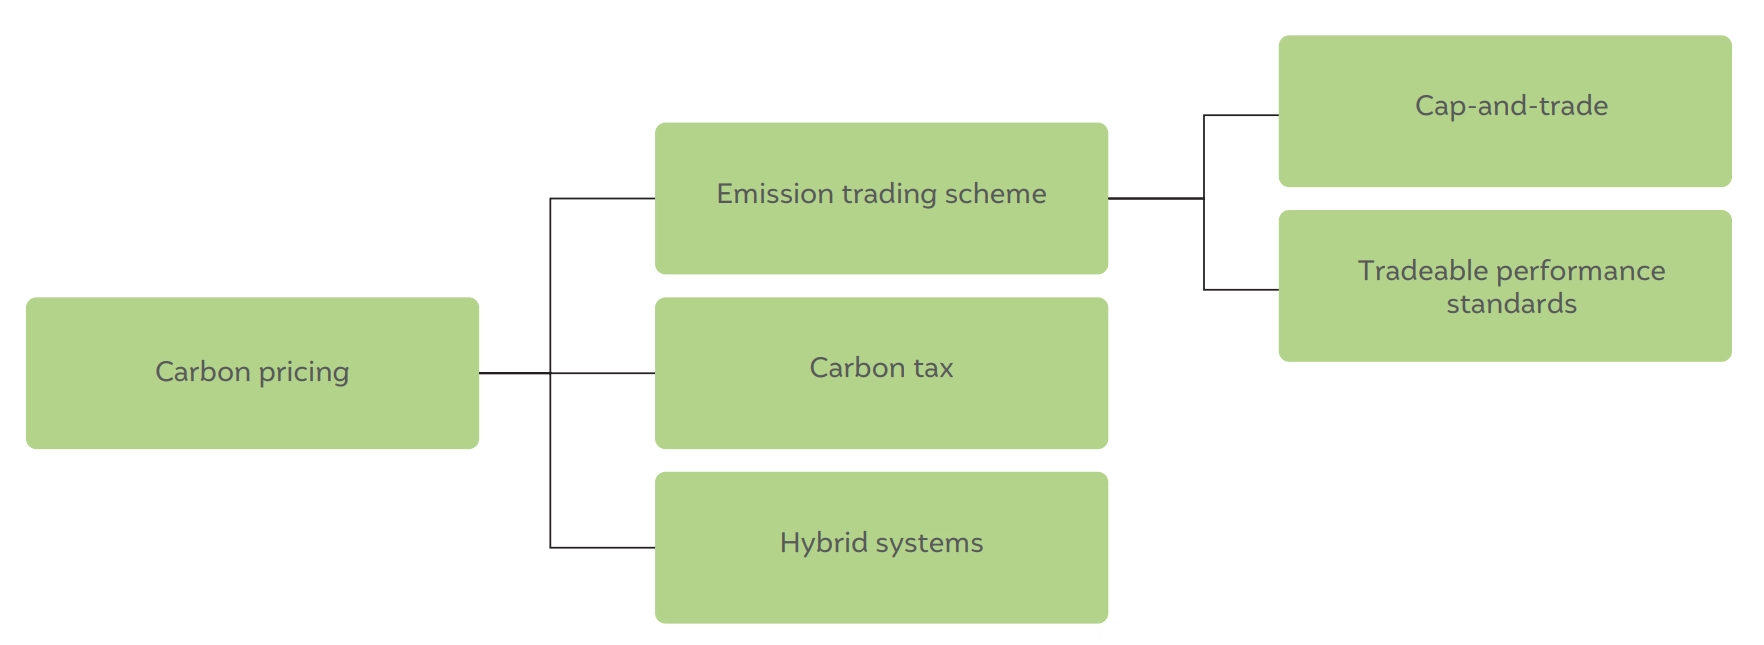
Source: Authors’ analysis
In most countries around the world, carbon pricing exists alongside other climate and energy policies to form a policy package. This is because carbon policies alone cannot solve the various institutional, political, and regulatory barriers to decarbonisation (Mehling and Tvinnereim 2018; Bertram et al. 2015; Klenert et al. 2018; Patt and Lilliestam 2018; Rosenbloom et al. 2020; Twomey 2012; Jaffe, Newell, and Stavins 2005). Thus, although policies co-exist due to having different objectives, due to the interconnected nature of energy flows and the sectoral overlap of policies, it is critical to understand the interaction between carbon pricing and other non-market energy policies. Poor policy integration could have negative consequences in the form of higher costs to society and increased risk of stranded assets (Hood 2013; Binsted et al. 2020; Iyer et al. 2015). Therefore, we need an optimal mix of policies that can ease both price- and non-price-related barriers to decarbonisation. Further, the policy mix must consider the impact of other policies on GHG emission reduction when setting the emission reduction targets of an ETS.
An effective ETS should align with a nation’s unique realities and contribute to its long-term decarbonisation goals. Currently, as India’s ETS is in its infancy, no analytical studies have explored its potential benefits for India’s decarbonisation strategy and sector-specific emission targets or its interaction with existing policies. Our study aims to fill this knowledge gap by addressing three core questions: i) What role can an ETS play in India’s goal of achieving net-zero CO2 emissions by 2070? ii) How will different sectors respond to the ETS? iii) What are the interactions between the ETS and existing policies such as RPOs?
The next section presents our scenario-modelling approach, followed by a presentation of the results in the third section. We devote Section 4 to discussions, including the limitations of the study, and present the conclusions in Section 5.
We use the Global Change Analysis Model v 6.0 (GCAM 6.0) (GCAM 2023) CEEW version to investigate the efficacy of an ETS and understand its complementarity with other important climate policies such as RPOs. We modify key parameters such as socioeconomics and price of key energy fuels to industry in the stock model to better represent India-specific realities and expectations (for the complete list of changes, see Section A1 in the Annexures). These assumptions are in line with those in GCAM-CEEW, which has been used before to understand net-zero scenarios for the Indian economy (Chaturvedi and Malyan 2022)but it has not been used here due to the lack of industry sector disaggregation in the model version.
Figure 2 Schematic framework of the Global Change Analysis Model (GCAM)
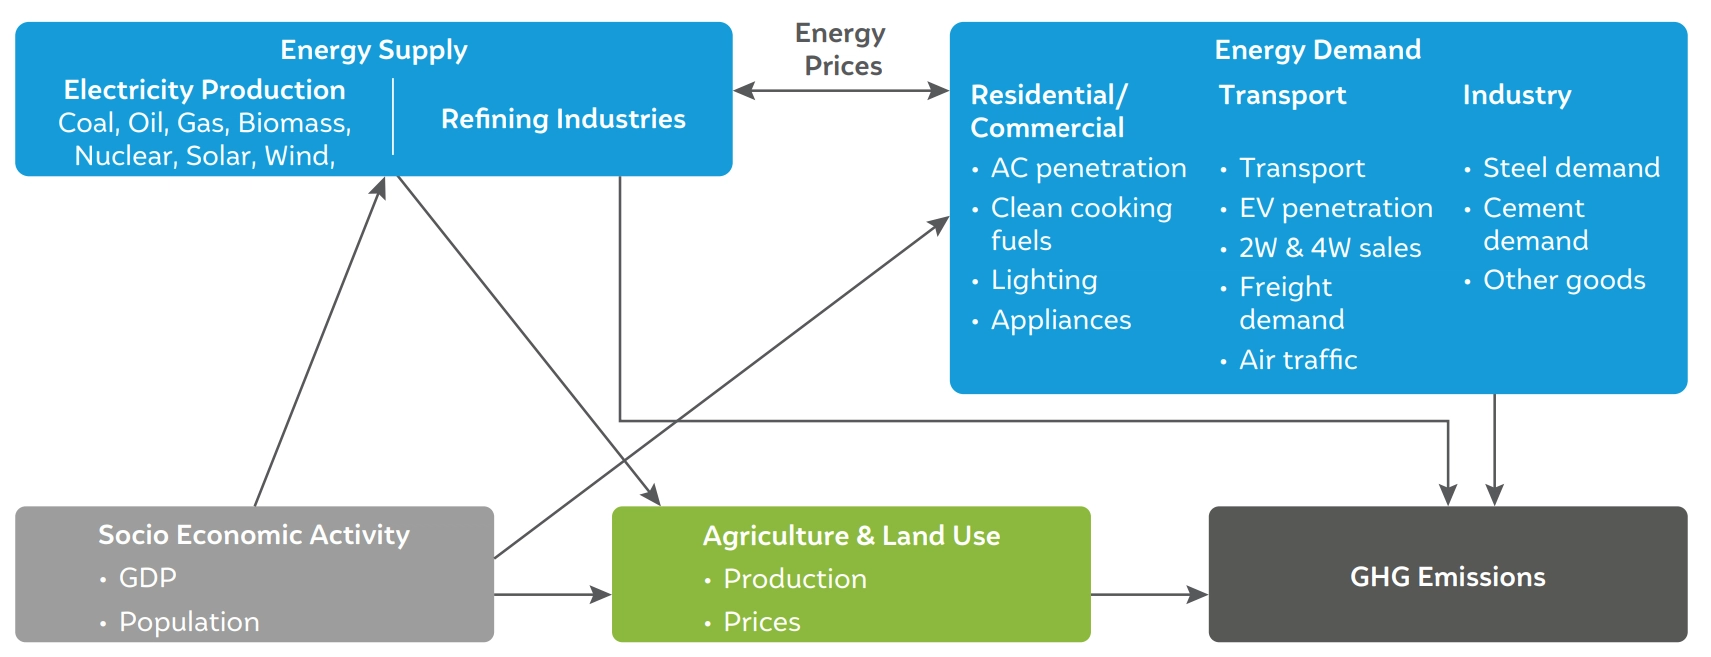
Source: Authors’ analysis
Global Change Analysis Model (GCAM)
The GCAM is a global integrated assessment model that has been used extensively for energy and climate policy analysis at both the national and global levels (Ou et al. 2021; Fawcett et al. 2015; Iyer et al. 2022, 2017; Cui et al. 2021; Yu et al. 2019), including in India (Chaturvedi and Malyan 2022; Chaturvedi, Koti, and Chordia 2021; Chaturvedi, Nagarkoti, and Ramakrishnan 2018). It was first developed in the 1970s and has been updated continuously since then to better represent the latest science in the energy, land, water, economic, and climate systems. The current model version (at the time of writing this study), GCAM 6.0, was released on June 7, 2022.
The key drivers of future sectoral energy growth in the model are gross domestic product (GDP) and population growth over time. Further, it has detailed representations of technologies, efficiencies, costs, and prices for estimating future energy demand. Technologies and fuels compete with each other on the basis of the costs of providing a particular service. For example, electric cars and petrol cars compete on the basis of capital and fuel costs. The capital costs and efficiencies of all technologies are exogenous, while the energy costs are endogenously determined. Similarly, in the electricity sector, coal, solar, wind, and other technologies (except hydro) compete with one another based on generation costs. On the demand side, the model covers the transportation, industry, and building sectors, and on the supply side, the electricity and refining sectors. See Figure 2 for a schematic representation.
Like most modelling exercises, this too does not aim to predict the future but strives to project how emissions from various sectors would evolve in various scenarios under a set of assumptions on emission limits, available technologies, efficiency growth, and energy costs. GCAM does not explicitly consider non-economic factors such as the equity and justice considerations of these technologies or the political economy and viability of these approaches; rather, it assumes that future outcomes are largely driven by the economics of relative costs, supply, demand, and prices.
Industry-sector modelling in GCAM
The industry sector in GCAM v.6 is divided into two main categories: the manufacturing and non-manufacturing sectors, which are further classified into nine sub-sectors. The manufacturing segment consists of six sub-sectors, namely, iron and steel, chemicals, aluminium, cement, fertilisers, and other industries, while the non-manufacturing segment includes three sub-sectors, namely, construction, mining energy use, and agricultural energy use. The ‘other industry’ sector encompasses all the remaining industries that are not specifically accounted for, such as food processing, textiles, and pulp and paper. Historical data on the energy balance and industrial output are calibrated using data from International Energy Agency (IEA) energy balances and worldwide industrial associations, respectively (GCAM 2023). Future growth in industrial output is determined using exogenous socioeconomic indicators such as gross domestic product (GDP), price elasticity, and income elasticity (GCAM 2023). The present industrial structure does not consider the global trade of industrial commodities, i.e., we assume that countries are self-sufficient in the manufacturing of these technologies. Sectors within the industry sector are given exogenous efficiency improvements in line with the PAT scheme (see Annexures Section A1.1 for more details).
All the existing technologies and fuels are represented within each industrial sub-sector. These technologies as well as fuels compete on the basis of cost and a substitutability factor represented through the logit function. A detailed example is given based on the iron and steel industry in the Annexures (refer to Section A2 in the Annexures); for other sectors, please refer to GCAM’s documentation (GCAM 2023).
Choice of ETS sectors for our modelling assessment
This study focuses on a specific subset of these sectors, selected for their potential insights rather than to provide a complete replica of an actual ETS. The first is the electricity sector, significant both for its emissions contribution as well as its rapid advancements in decarbonisation technologies. The remaining three sectors – iron and steel, cement, and fertilisers – represent vital sectors for industrial decarbonisation. In conjunction, these sectors encompass a balanced mix of relatively easier and more challenging emission abatement scenarios, accounting for approximately 52 per cent of India’s total GHG emissions (excluding Land use, land-use change, and forestry (LULUCF), in 2016) and 65 per cent of energy-related emissions (Ministry of Environment, Forest and Climate Change, Government of India 2021). Our assessment solely addresses CO2 emissions, excluding other GHGs from India’s energy sector.
Mitigation cost assumptions across ETS sectors
One of the key premises of an ETS is that it allows us to harness low-cost mitigation opportunities across and within sectors, whose costs of mitigation can vary significantly. Sectoral abatement costs hence become a key assumption for modelling an ETS. We input a detailed suite of mitigation technologies across the ETS sectors. The cost assumptions for the three industrial sectors are based on IEA (2022) and Ren et al. (2021), as well as inputs from industry experts. Assumptions for mitigation technologies in the electricity generation sector are based on Chaturvedi and Malyan (2022). The cost assumptions for the ETS sectors are given in the Annexures (Section A1.2).
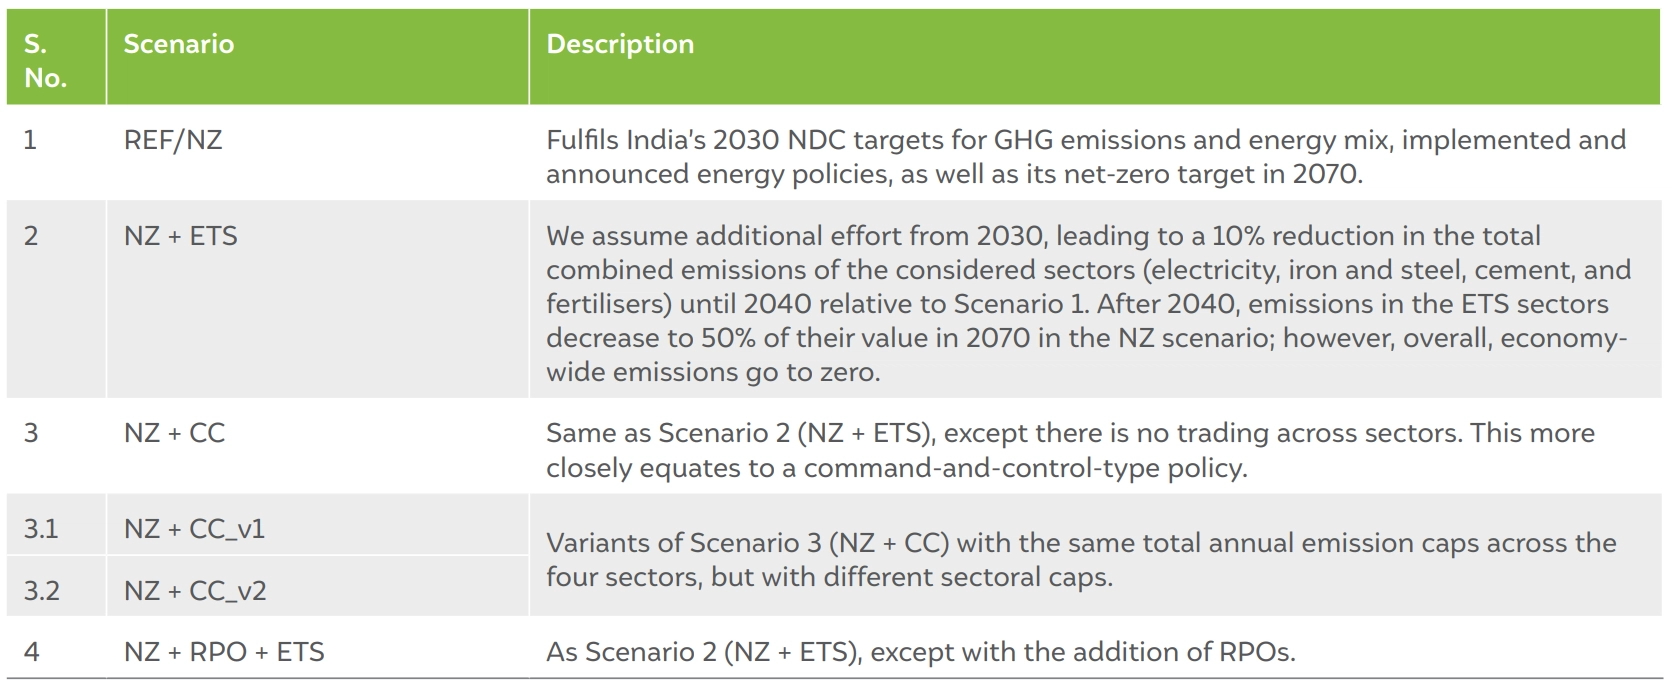
To investigate the mentioned objectives, we construct a set of four main scenarios (1, 2, 3, 4) and two scenario variants (3.1, 3.2), as shown in Table 1. A short description is given in the table, while a detailed description is provided in the text below.
Our REF or NZ scenario fulfils the major objectives of the NDC, including targets to: i) reduce the emissions intensity of the country’s GDP by 45 per cent by 2030 from the 2005 level; and ii) increase the share of non-fossil-fuel-based energy sources to 50 per cent of the cumulative installed capacity by 2030 (Press Information Bureau 2022). This level of ambition continues until 2040, beyond which we assume that overall emissions decline linearly to zero in 2070. The choice of the peaking year and the following linear decrease in emissions is based on previous analysis by Chaturvedi and Malyan (2022). This choice, however, implies that the model does not determine the time path of emissions based on cost-effectiveness, but it offers a cost-effective solution for an exogenously given time path chosen by the policymaker. This approach reflects the reality of decision-making in the real world, where choices are influenced not only by cost-effectiveness but also by factors such as the domestic context, expectations, and international negotiations (Chaturvedi and Malyan 2022).
We also assume that there will be increasing energy-efficiency improvements in all end-use sectors, including the industry sector, where they will be in line with or exceed PAT scheme targets. The capital costs for key low-carbon technologies such as solar, wind, and batteries are expected to reduce over time. Additionally, we assume that the current policy and investment push for cheap hydrogen continues and leads to low hydrogen costs.
Table 1 Scenario names and descriptions used in the study
Source: Authors’ compilation
Table 1 presents scenarios 2 to 4, which include additional policy assumptions on top of the business-as-usual/net-zero (REF/NZ) scenario. In the NZ + ETS scenario, a combined ETS cap is implemented for the four sectors. Specifically, we assume that additional efforts will be made to reduce the total combined emissions of the four ETS sectors by 10 per cent by 2040, relative to REF/NZ, starting with a 3 per cent reduction in 2030, and increasing linearly to 10 per cent by 2040.2 From 2040 onwards, the overall cross-sectoral emission cap is assumed to decline linearly, totalling 183 MtCO2 in 2070. We intentionally leave out the RPO targets in the NZ + ETS scenario, although they are currently in operation, to understand their complementarity with an ETS; they therefore constitute a separate scenario.
The NZ + CC scenario is similar to Scenario 2 (NZ + ETS), except that there is no trading across ETS sectors. The main purpose of this scenario is to explore the cost-effectiveness of a trading vs a no-trading scenario.
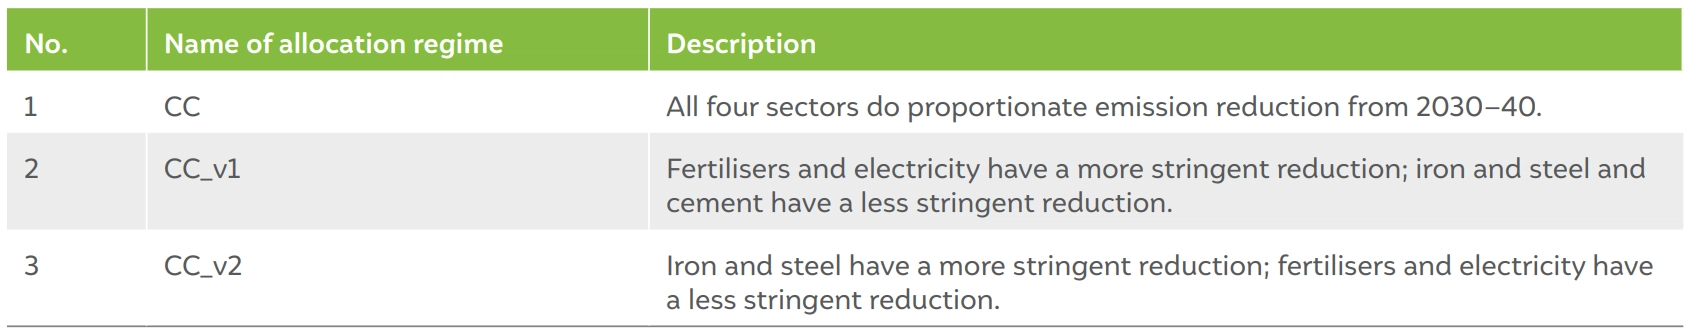
Two scenario variants, NZ + CC_v1 and NZ + CC_v2, additionally explore the sensitivity of cross-sectoral financial transfers due to a different underlying distribution of sectoral caps. The actual percentage reduction with respect to the baseline (REF/NZ) is given in Annexure Section A7.
The NZ + RPO + ETS scenario assumes that in addition to a combined ETS for the four sectors, there is an RPO for electricity distribution companies across the states in India. We seek to explore the interaction effects of the RPO policy with the ETS. As prescribed by the Ministry of Power, the RPO policy aims to increase the share of RE-based electricity generation from 24.6 per cent in 2023 to 43.3 per cent in 2030 (Ministry of Power, Government of India 2022). We then extend the targets linearly until 2040. This results in RE-based electricity generation accounting for 73 per cent of the total capacity in 2040. Beyond this point, we assume that there will be no mandatory RPOs, as the share of RE is high enough that no policy support is needed anymore.
Socioeconomic and demand trends
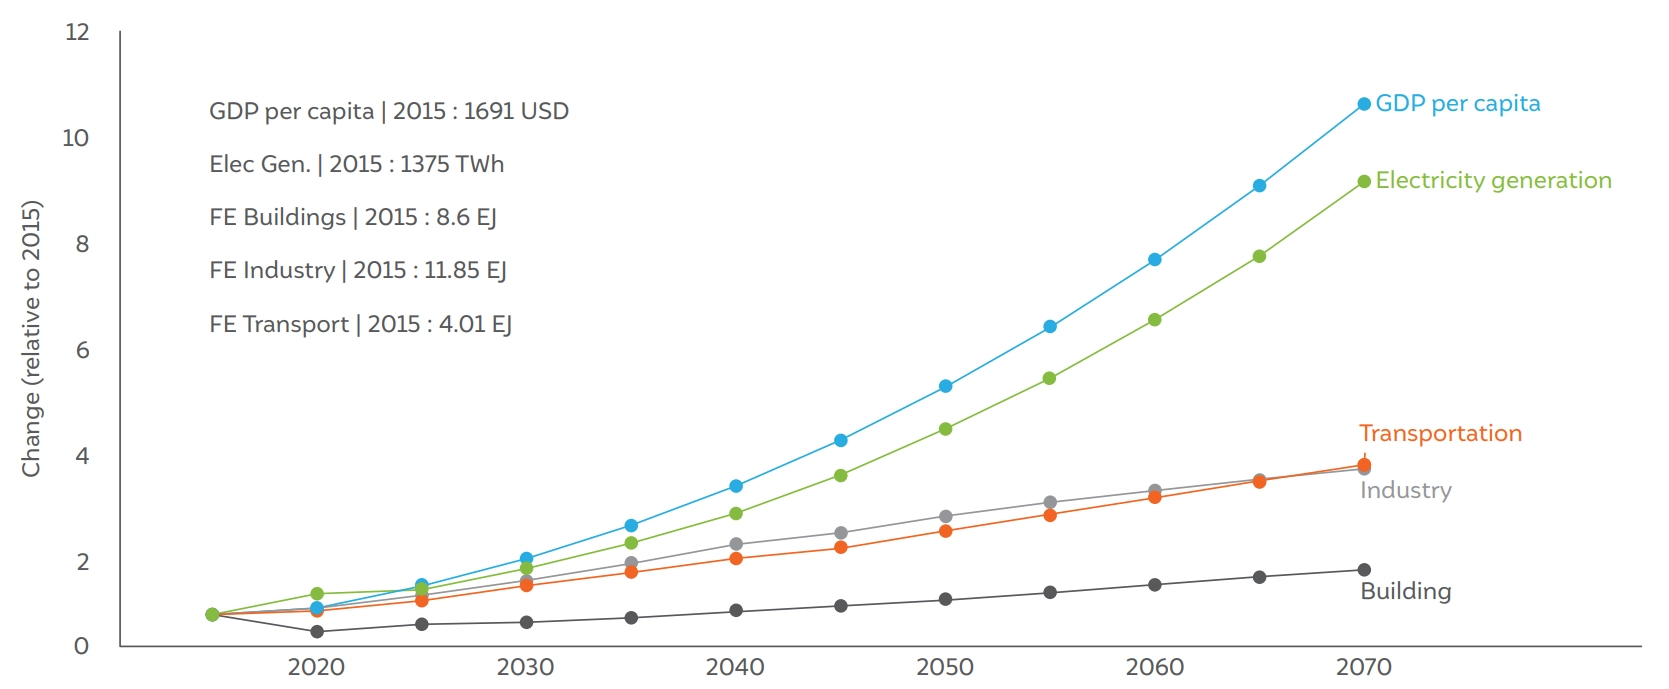
Our REF/NZ scenario assumes a rapid growth of the Indian economy with per capita income rising 5x in 2050 and 11x in 2070, relative to 2020 (Figure 3) (see Section A1 in the Annexures for growth rate assumptions, GDP is nominal). This rapid growth in income leads to a significant increase in the demand for all industrial commodities such as iron and steel, cement, and aluminium, which, when combined with other end-use sectors such as buildings and transportation, leads to a significant increase in energy requirements, especially electricity generation (Figure 3 and Figure 5). Both the transportation and industry sectors grow at similar rates (in terms of energy demand); however, the growth in energy demand from the building sector is almost half as much. The industry sector, which currently consumes almost 50 per cent of the total final energy (FE) demand, also continues to account for the highest share of future energy demand.
Figure 3 Growth of selected indicators to illustrate socioeconomic and demand trends in the REF/NZ scenario relative to 2015
Source: Authors’ analysis
Drivers of emission change
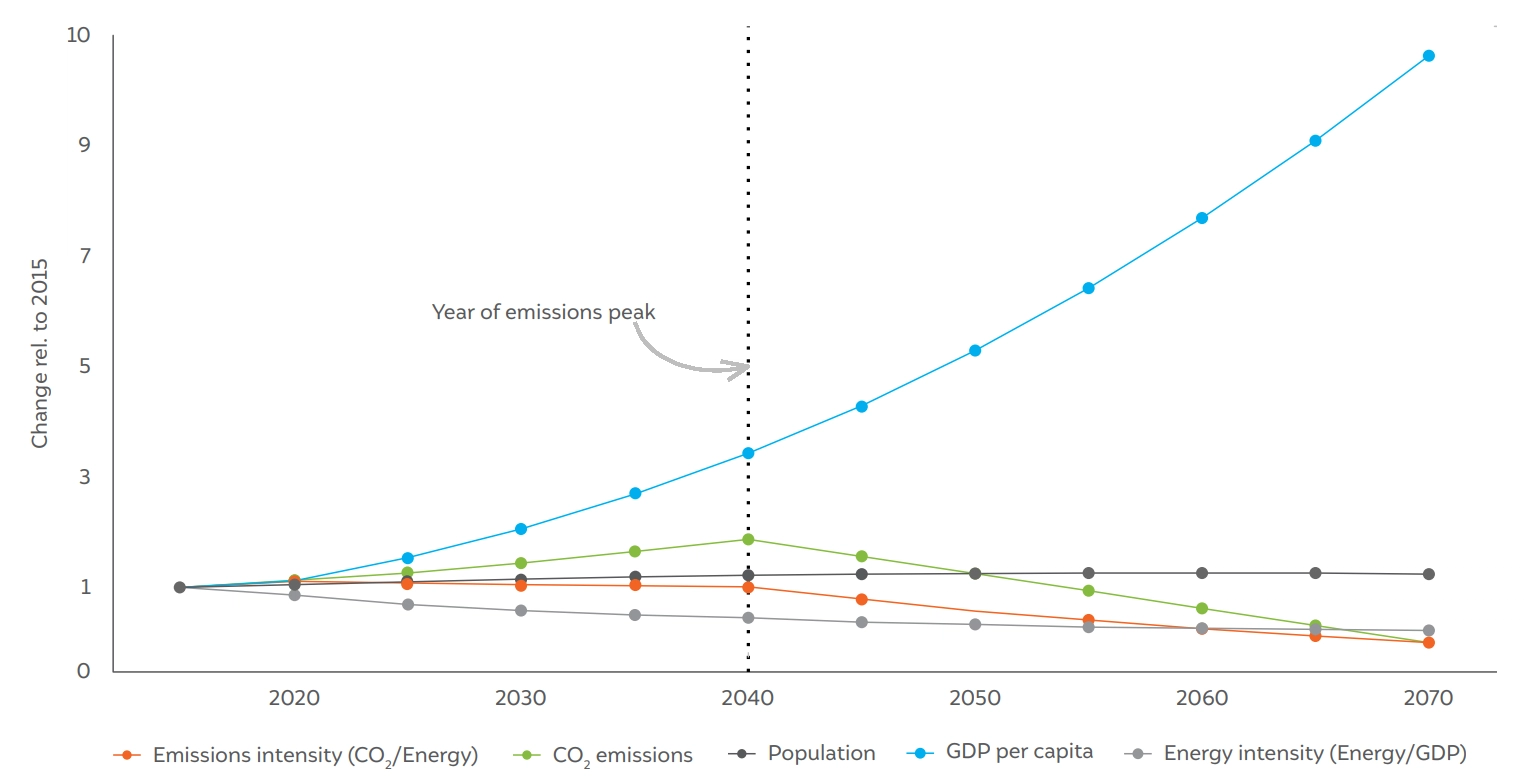
The Kaya Identity is a mathematical identity, developed by Japanese economist Yoichi Kaya (Kaya and Yokobori 1997) that provides a useful way of understanding the drivers of emission change in an economy. It states that the total emissions in an economy can be expressed as the product of four factors: population, GDP per capita, energy intensity (per unit of GDP), and emission or carbon intensity (emissions per unit of energy consumed). Figure 4 shows the variables of the Kaya identity for the NZ scenario for India. Until 2040, the increase in emissions (yellow) is mainly due to rising income (GDP per capita) and population (grey), with the growth in emissions is lower than the increase in income. This is mainly because of two reasons: one, the decrease in energy intensity (green) caused by energy efficiency improvements such as the increasing use of energy-efficient appliances and industrial equipment, as well as from the increased penetration of electric vehicles and the replacement of traditional biomass-based cooking with gas-based cooking; two, the slow but gradual decrease in the emission intensity of energy (orange) as more renewables and low-carbon energy sources enter the energy system. After peaking in 2040, emissions decrease strongly (to reach the net-zero 2070 target), from decrease in emissions intensity. This is because of the significant growth of RE on the supply side as well as electrification, hydrogen use, and carbon capture and storage (CCS) in the end-use sectors (illustrated in subsequent subsections).
Figure 4 Indicators of the Kaya Identity to explain the drivers of emission change in the REF/NZ scenario
Source: Authors’ analysis
Emission trends and production structure of the considered sectors in the REF/NZ scenario
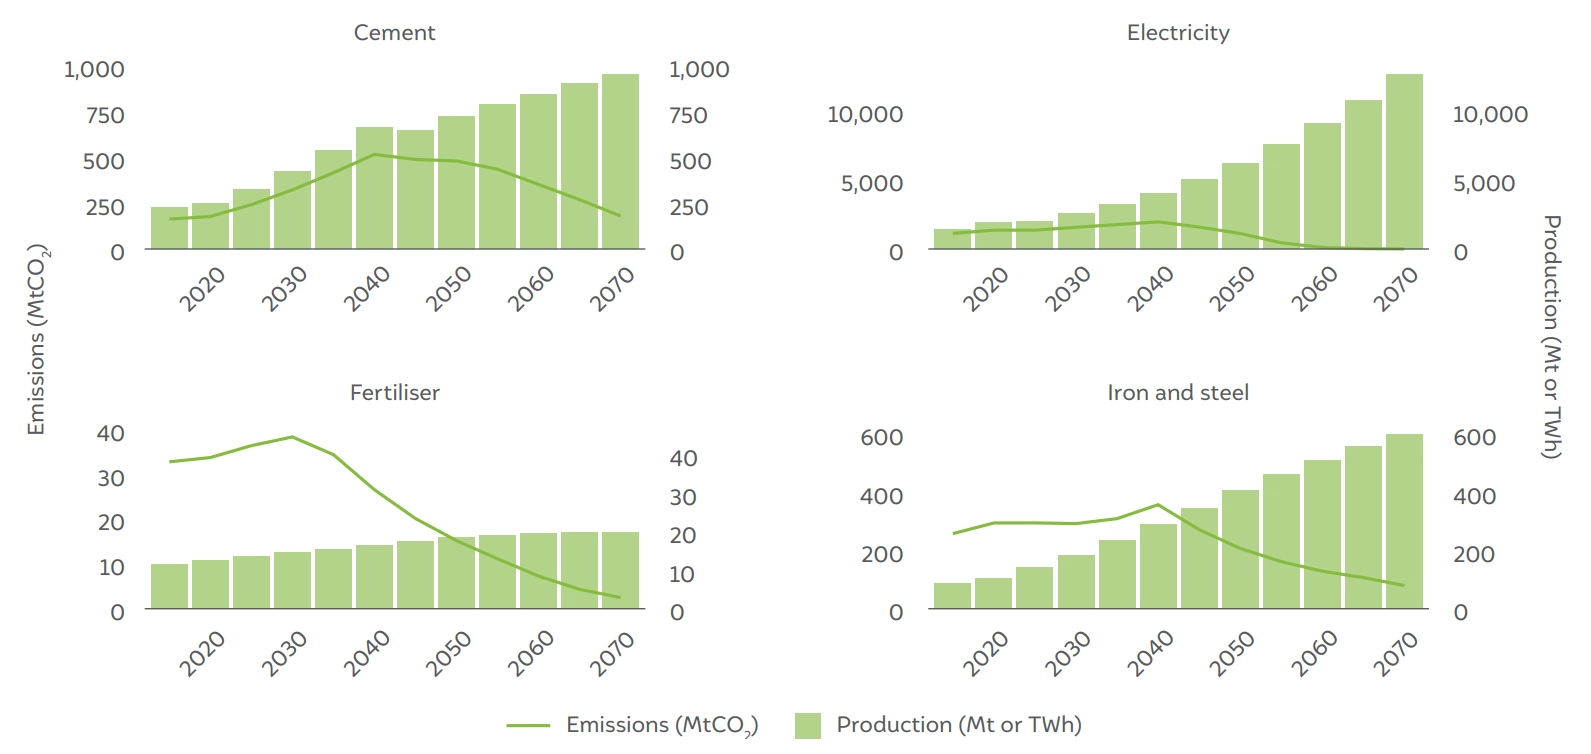
In the electricity sector, most of the additional demand for electricity is met through variable renewable energy (VRE) sources, particularly solar, driven by lowering capital costs, policies supporting the development of transmission and infrastructure, and nominal intermittency costs; for example, in the form of storage. However, despite the increasing cost competitiveness of VRE, in the absence of policies targeting coal, conventional coal electricity plants continue to expand until 2040, leading in turn to a rise in electricity sector emissions (Figure 5a). The combined effect is that, by 2040, almost 36 per cent of the electricity generation comes from solar and wind compared to the current 10 per cent, while coal-based generation decreases from 68 per cent in 2020 to 48 per cent in 2040 (derived from Figure 5b, which has absolute numbers).
As mentioned in Section 2.2, based on the exogenous constraints, from 2040 onwards, there is a sharp decrease in economy-wide emissions on the path to net zero This gives rise to an endogenously derived carbon price, which permeates through all sectors, leading to a reduction in emissions. In particular, in the electricity sector, where emission reduction is relatively inexpensive, there is a significant expansion of solar photovoltaics as well as increased generation of biomass�based electricity and more efficient coal electricity plants. By 2060, the electricity system is almost fully decarbonised, with solar accounting for the dominant share and small contributions from wind, nuclear, and biomass (refer to Figure 5b).
Figure 5a Production (Mt or TWh) and emissions (MTCO2)for the selected ETS sectors considered in this study
Source: Authors’ analysis
Figure 5b Absolute electricity (TWh) generation from different technologies in the REF/NZ scenario
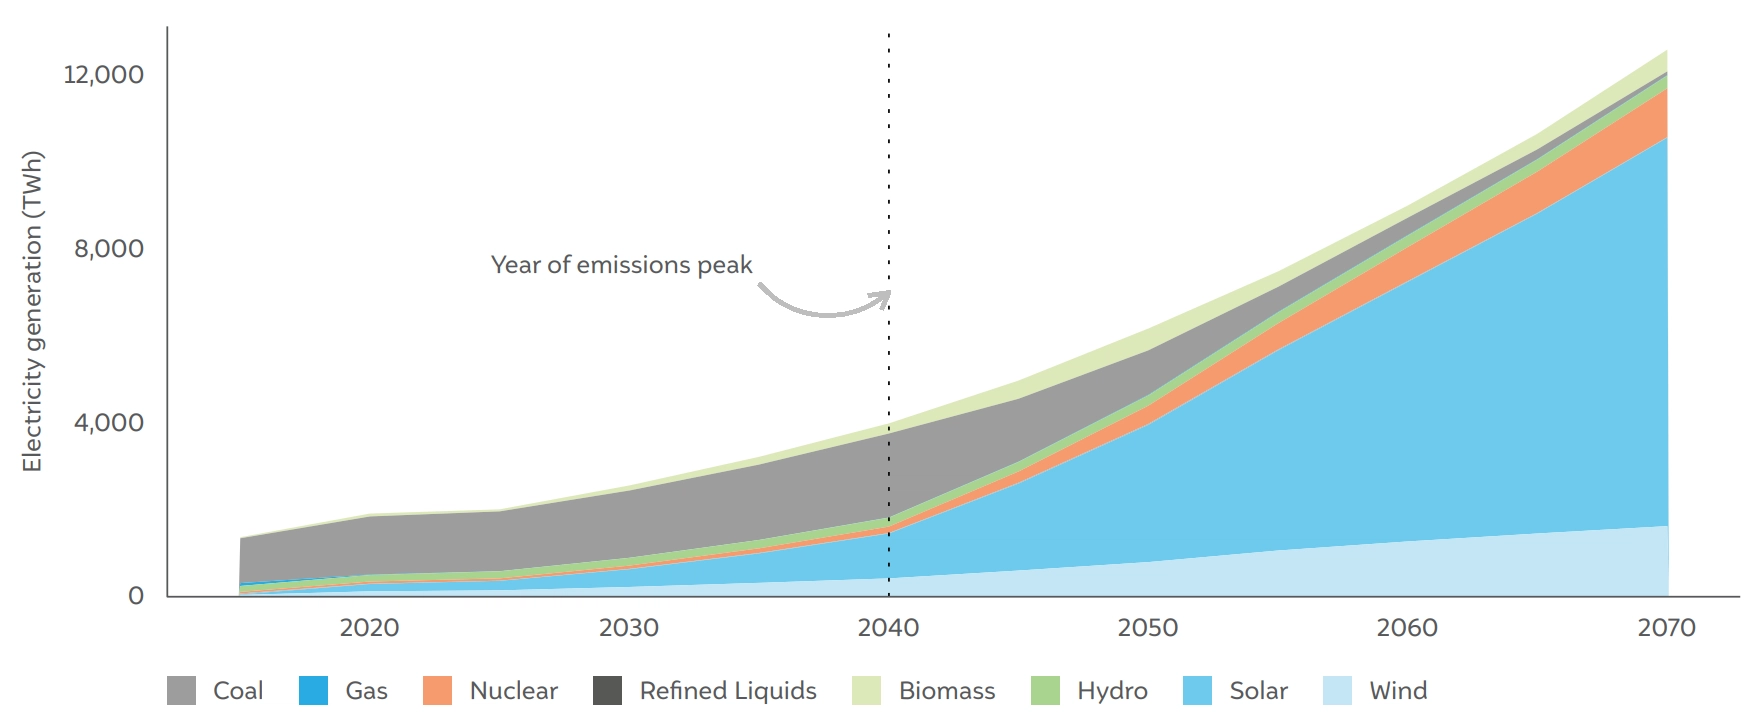
Source: Authors’ analysis
Figure 6 Share of final energy by fuel in the REF/NZ scenario
Source: Authors’ analysis
Figure 7 Total emission trajectories of four scenarios: REF/NZ, NZ + ETS, NZ + CC, and NZ + RPO + ETS
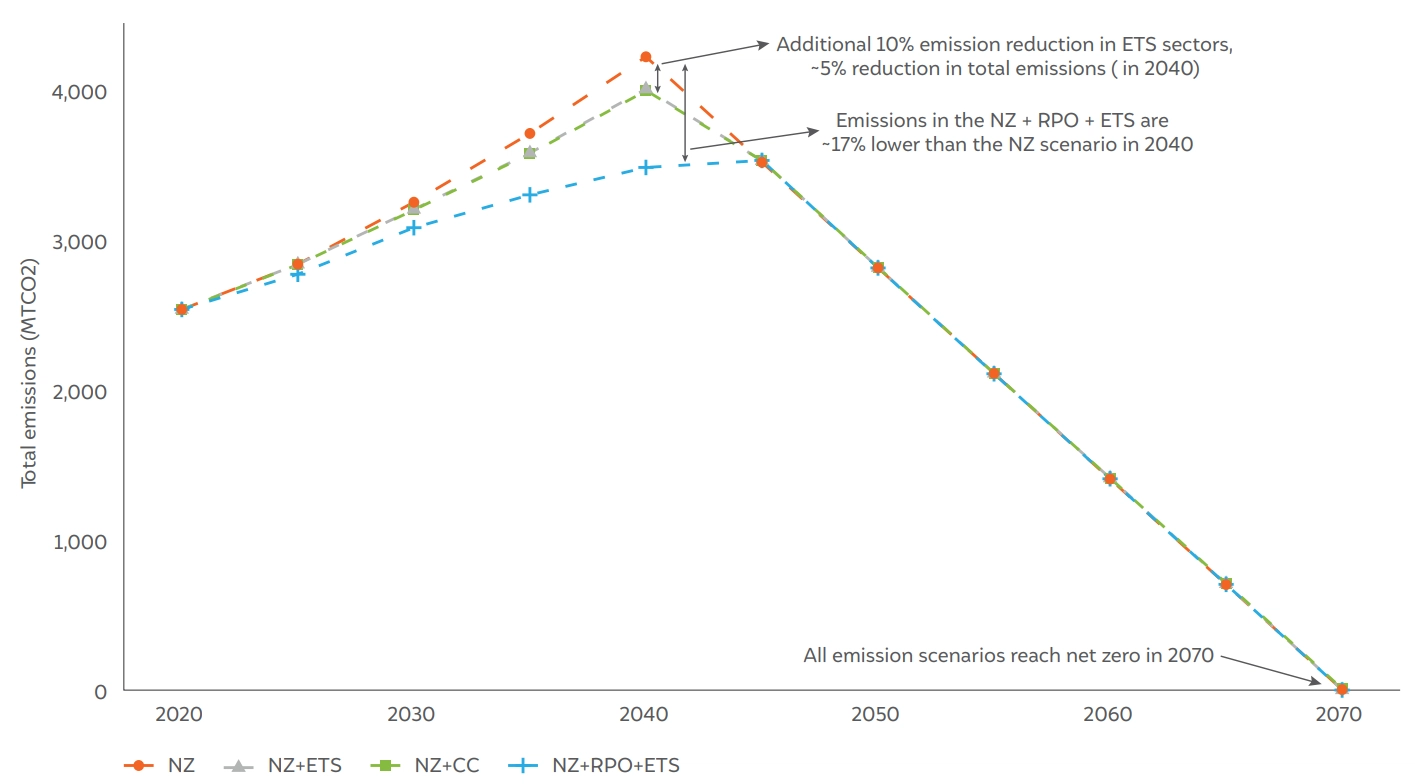
Source: Authors’ analysis
Beyond electricity, demand for other materials such as iron and steel, cement, and fertilisers also increases,3 driving emission growth in these sectors (Figure 5a). With the exception of emissions from the fertilisers sector – which peak in 2030 (Figure 5a) – the rest of the considered sectors peak in the same year as the whole economy, i.e., 2040. Due to the economy-wide emission constraint, after 2040, a combination of fuel-switching, higher end-use electrification, use of CCS, and hydrogen use lead to decarbonisation in the industrial sectors (Figure 6). Note that apart from the electricity sector, emissions in the other considered sectors do not fall to zero in 2070 (refer to Annexures Section A6 for sectoral-emission trajectories). This is because both the iron and steel sector as well as the cement sector consume a significant amount of coal even in 2070. Total emissions from these two sectors are ~265 MtCO2 in 2070. Emissions in these hard-to-abate sectors are compensated by negative emissions principally in the agriculture, forestry, and other land use (AFOLU) sector, leading to overall net-zero emissions in 2070.
The emission trajectories of the REF/NZ scenario and NZ + ETS scenario are shown in Figure 7. As mentioned before, the NZ scenario reaches its emissions peak in 2040, following the currently implemented energy and climate policies (except RPOs). After 2040, emissions decrease linearly to zero in 2070. In the NZ + ETS scenario, we constrain emissions only for the ETS sectors, at a level lower than in the NZ scenario. In 2040, emissions from the ETS sectors are 10 per cent lower than in the NZ scenario, leading to a ~5 per cent decline in overall emissions. The NZ + RPO + ETS scenario considers the effect of both RPOs and the ETS and leads to a ~15 per cent reduction in total emissions. This scenario is explained in more detail in Section 3.4.
To demonstrate the cost-effectiveness of an ETS, we compare the policy costs of an NZ + ETS scenario with an NZ + CC scenario, i.e., where no emission trading is allowed (for the same total emission reduction in a given year). In practice, this would mean, that in an ETS, for example, the cement sector, depending upon its targets, might choose to either decrease emissions itself by investing in low-carbon technologies or buy emission permits from the market if these are cheaper. However, in a command-and-control (CC) type policy, the cement sector can only do ‘in-house’ emission reductions.
Figure 8 shows the mitigation cost for the two scenarios for 2030–40. Mitigation costs in scenarios with trading are 30–45 per cent lower compared to the scenario without trading.
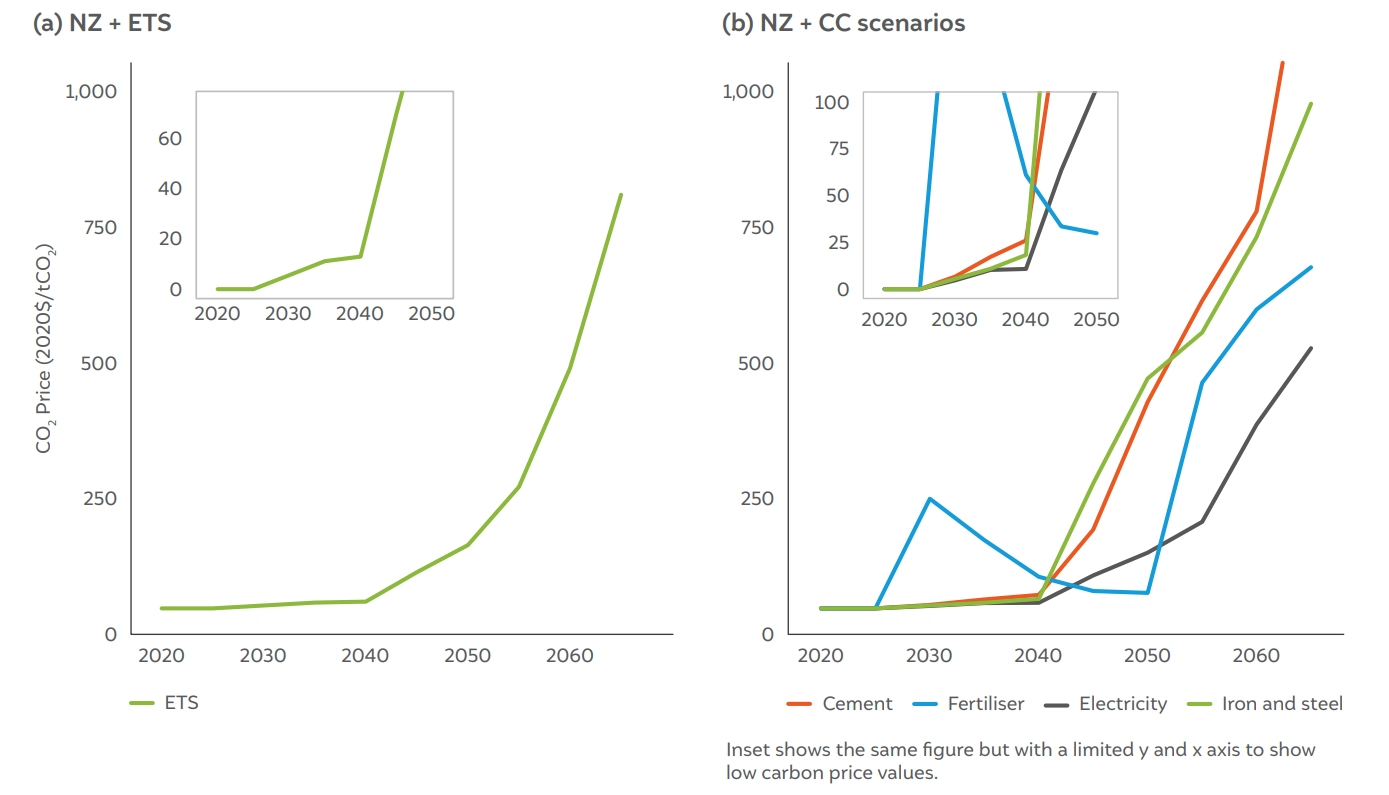
The principal reason behind the lower mitigation costs in the ETS scenario is that the economy is able to harness low-cost opportunities across sectors; the carbon price that emerges in the ETS sectors when trade is permitted is an indicator of the same. Figure 9 shows that when trading is allowed, the sectors have a uniform carbon price – around USD 13/tCO2 in 2040. However, when no trading is allowed, the carbon price varies across sectors greatly, from around USD 10/ CO2 in the electricity sector to over USD 60/tCO2 in the fertiliser sector. It is important to note that the carbon price in the ETS is not a prediction but a result of specific assumptions about: i) the total ETS emission cap; ii) sectors included in the cap; and iii) the abatement costs and potentials of individual sectors. Similarly, for the NZ + CC scenario, the carbon price in individual sectors depends upon: i) the relative ease of abatement in the sector, i.e., the cost of the decarbonisation options available to the sector; and ii) the emission targets of the sectors.
Figure 8 Mitigation costs across the two scenarios, NZ + ETS (with trading) and NZ + CC (without trading), from 2030 until 2040
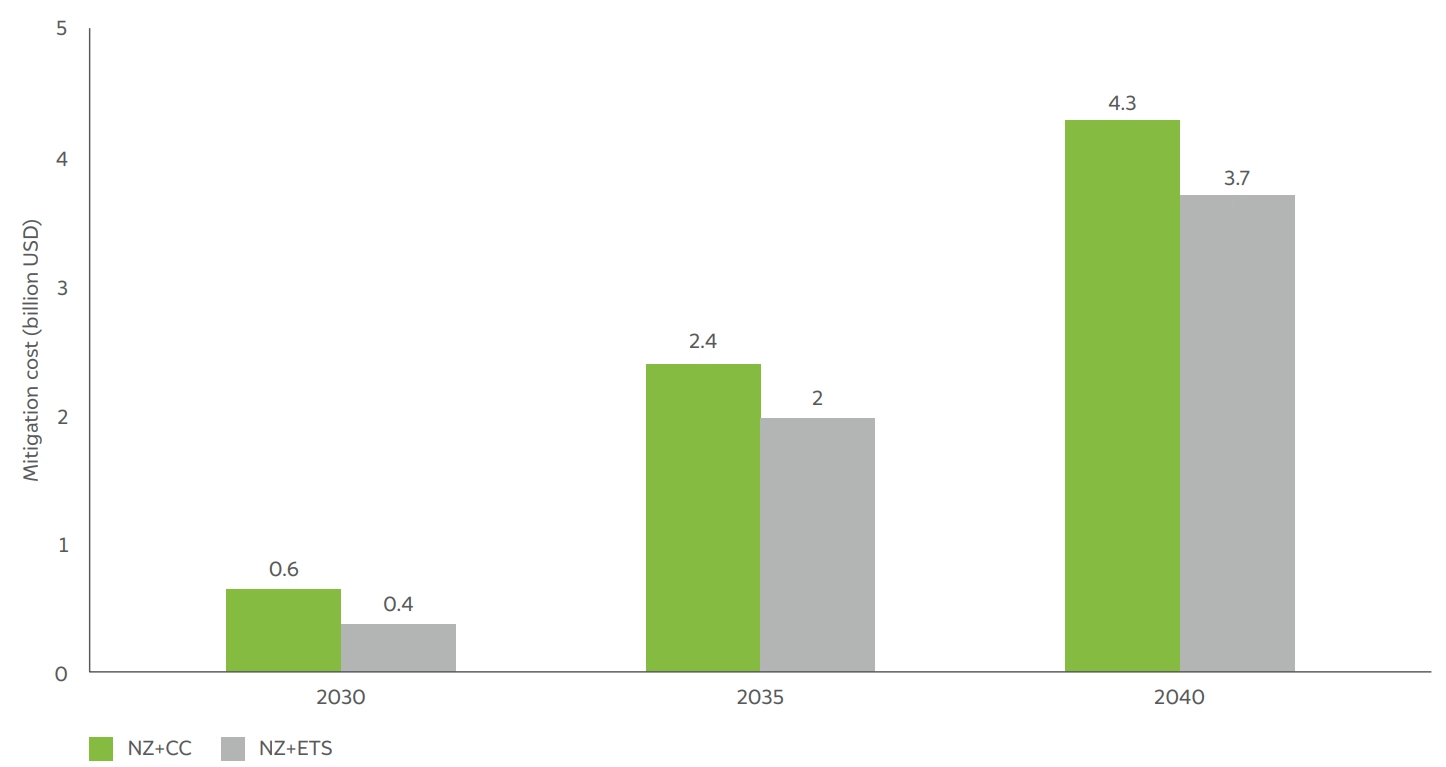
Source: Authors’ analysis
Figure 9 Carbon price in (2020$/tCO2) for the (a) NZ + ETS and (b) NZ + CC scenarios
Source: Authors’ analysis
Figure 10 Absolute emissions of the four considered ETS sectors in the NZ + ETS scenario vs. the NZ + CC scenario
Source: Authors’ analysis
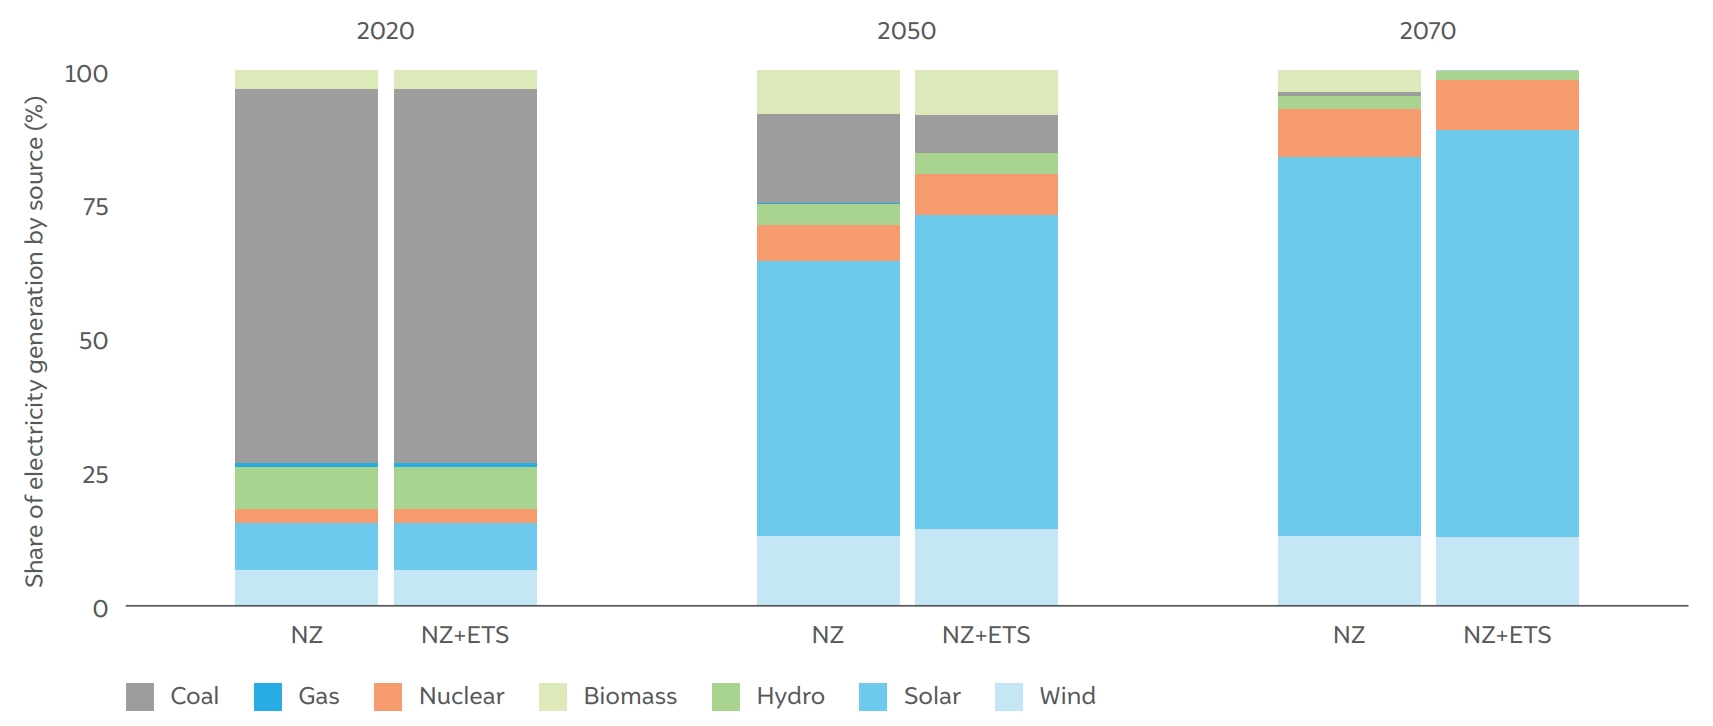
Figure 11 Share of electricity generation by source in 2020, 2040, and 2070 in the REF/NZ and NZ + ETS scenarios
Source: Authors’ analysis
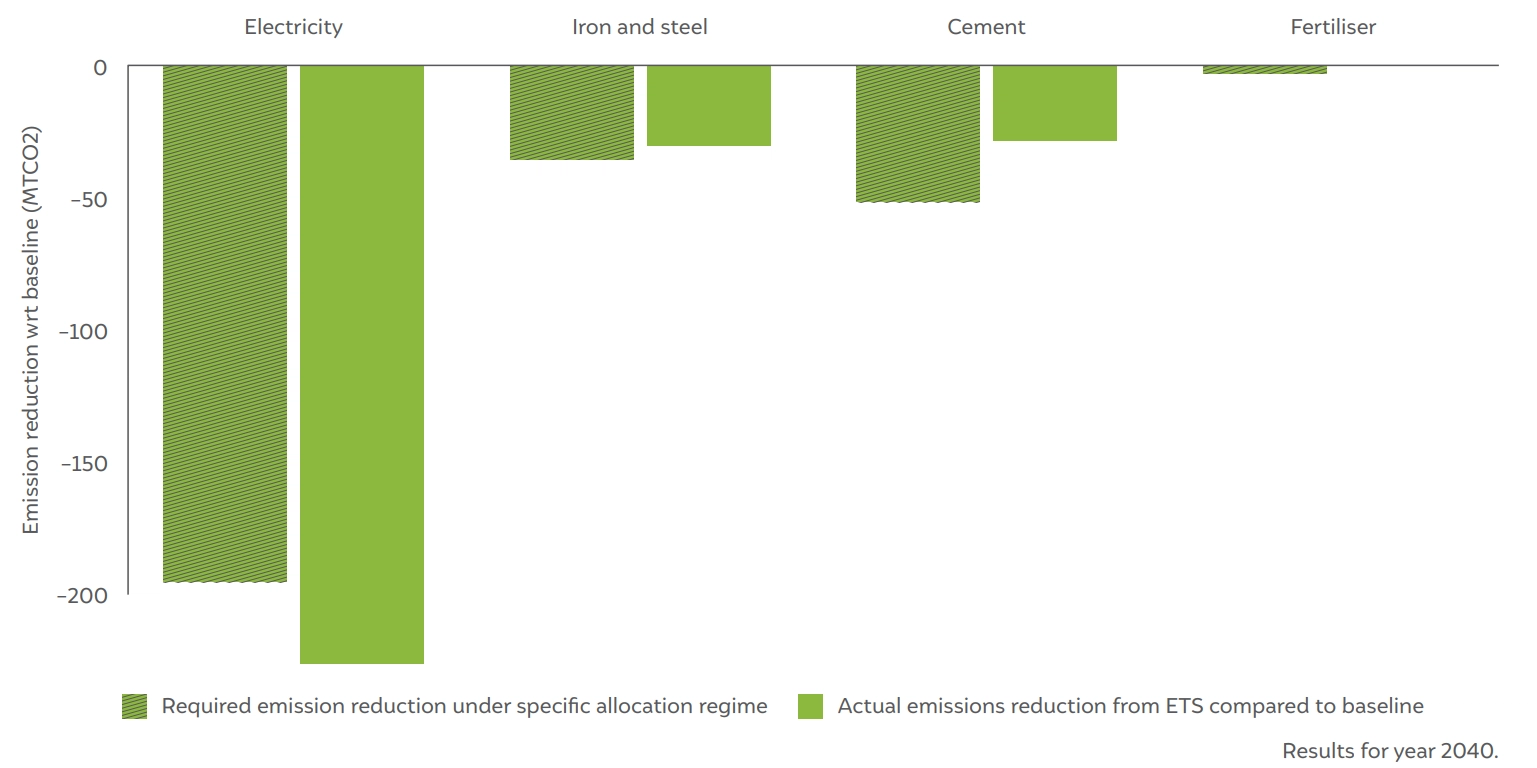
If an emissions cap is levied as part of the ETS, the electricity sector emerges as the largest contributor to emission reduction. The sector not only has cheap mitigation options, mainly from the installation of RE, but it also has significant potential for absolute emission reduction. From Figure 10 (non-dashed bars), the share of emission reduction – compared to the baseline in 2040 – can be calculated. The share of emission reduction is 72 per cent in the electricity sector, followed by 17 per cent in the iron and steel sector, and 10 per cent in the cement sector, with the fertilisers sector doing almost no emission reduction.
How do emission reductions happen in the electricity sector? Under a carbon price, the operating costs of fossil-fuel-based electricity plants increase due to an increase in the fuel price, forcing them to reduce their plant load factors (see Section A5 in the Annexures for generation costs by fuel). Coal, which has the highest fossil-carbon intensity among fossil fuels, is affected the most; therefore, coal should be increasingly substituted with other lower-carbon fuels. However, although the generation costs of coal increase under the ETS, the costs of other combustible fuels that could replace coal generation, such as biomass and gas, are still much higher, preventing their uptake. Instead, the electricity demand is fulfilled by new solar and wind plants coming online. Figure 11 shows that, in the year 2050, the share of solar and wind in total electricity generation in the NZ + ETS scenario increases by almost 7 per cent and 1.4 per cent (from 51 per cent to 58 per cent for solar and 12.9 per cent to 14.3 per cent for wind) respectively, compared to the reference scenario.
The electricity sector emerges as the principal source of emission reductions. However, the specific sector selling or buying emission permits in an ETS depends on the sectoral allocation and ETS compliance strategies adopted by individual entities. In the allocation assumed in the NZ + CC scenario (all ETS sectors must perform the same percentage emission reduction; shown as dashed bars in Figure 10), the electricity sector would sell permits, while the iron and steel, cement, and fertilisers sectors would buy these permits. The financial implications of different allocation regimes are explored in Section 3.6.
Unlike between 2030 and 2040, where we assume an ETS cap with respect to the baseline for the four sectors (leading to a 10 per cent reduction in combined emissions in 2040), for the years following 2040, we assume that the sectors collectively follow a linear path and reach 183 MtCO2 in 2070 (see Figure A6 in the Annexures). We do not assume net-zero emissions from these four sectors, because in the absence of net-negative emissions from the AFOLU sector (the AFOLU sector is not part of the ETS), the cost of mitigation is so high that it results in a fall in overall production from the high carbon price.
This is particularly the case for the cement sector where mitigation options are fewer (for example, for feedstock emissions), and a high carbon price leads to high cement prices, which in turn affects demand for cement. Moreover, since CCS is not assumed to have a 100 per cent efficiency, some residual emissions will remain.
Another factor influencing emissions in the ETS sectors during the post-2040 period is the indirect impact of mitigation policies in non-ETS sectors, since these sectors must also decarbonise to reach net zero in 2070. For example, the decarbonisation of the transport sector will lead to a lower demand for refined liquids and a higher electricity demand, which in turn will affect the prices of both these commodities. This will consequently impact the cost of the decarbonisation options available to the ETS sectors.
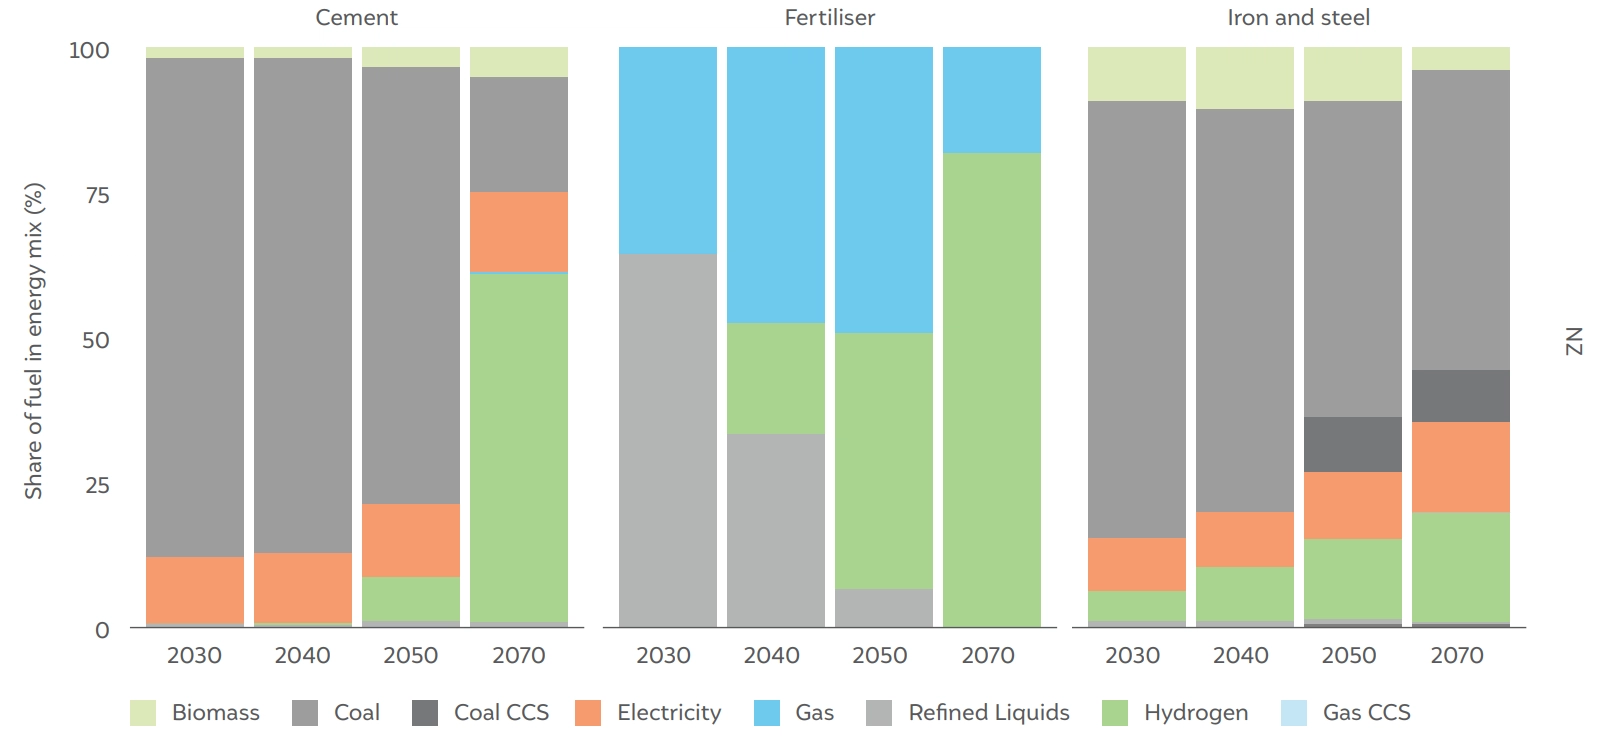
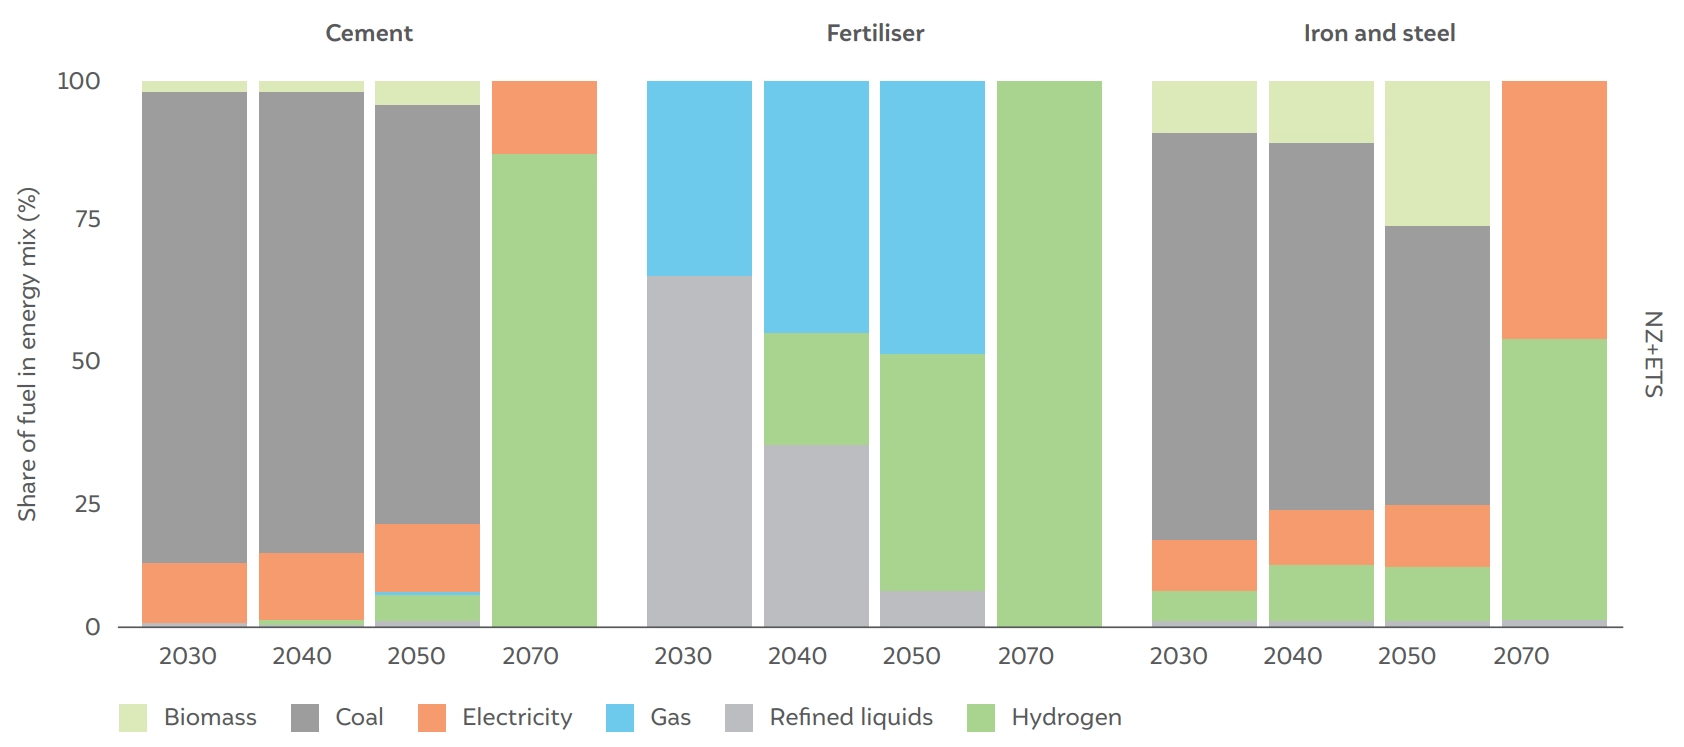
Figure 12 Share of final energy by fuel for three ETS sectors for the NZ + ETS scenario
Source: Authors’ analysis
Figure 10 also shows that although the electricity sector accounts for the maximum share of emission reductions in the ETS scenario, it does not account for all the required reductions; emission reductions also take place in both the iron and steel and cement sectors. In the presence of an ETS, these sectors can choose cheaper cost-effective options in the form of fuel-switching4 in the near term – for example, from coal to biomass or from refined liquids to natural gas. In the longer term, the decreasing ETS emission cap leads to a higher carbon price, which in turn leads to these sectors choosing more expensive options like hydrogen and electrification.
In the fertilisers sector, natural gas operates as a bridge fuel till 2050, beyond which there is a shift towards green hydrogen. The iron and steel sector moves towards electricity and hydrogen in the long run, with biomass coming in during the transition. The cement sector fuel mix shows a limited decline in the share of coal even till 2050. This implies that this sector is the hardest to abate and that heavy decarbonisation can happen in this sector only after the other industrial sectors are significantly decarbonised. Thus, even between the three industrial sectors, there is a different decarbonisation timeline depending on the cost of mitigation within each sector.
The iron and steel sector in GCAM includes three principal technologies of steel production: the blast furnace (BF) method, the direct reduced iron – electric arc furnace (DRI-EAF), and lastly, scrap iron (an EAF-based process). There are multiple technological options available within these processes; for example, BF can be combined with blast oxygen furnace (BOF), which is the conventional technology for steel production using primarily coal, but BF can also be combined with H2 or biomass, which are different technologies. Similarly, green steel, which is essentially hydrogen-based DRI-EAF, is also an available technology. Each of these three processes and/or technologies has multiple fuel options and the availability of CCS. The carbon price influences which fuels are used in existing technologies, while the carbon price along with technology and fuel costs influence technology choice for new investments.
The role of complementary policies is critical in the larger decarbonisation strategy for any country. India also has a number of policies across sectors, and the ETS will interact with many of these, especially when there are common sectors involved. We explore here the interaction effect of the ETS with RPOs. RPOs mandate electricity utilities to procure a certain share of their demand from renewable electricity. While an ETS makes fossil-based technologies more expensive and promotes fuel-switching among existing electricity plants, an RPO principally aims to support the deployment of RE by creating demand. RPO mandates issued by the Government of India are one of the strictest forms of existing climate policy in the country. For example, the most recent RPO update mandates that almost 43 per cent of electricity generation should be from renewables in 2030, which when increased linearly, translates to 73 per cent RE-based electricity generation in 2040. No RPO targets are assumed beyond 2040.
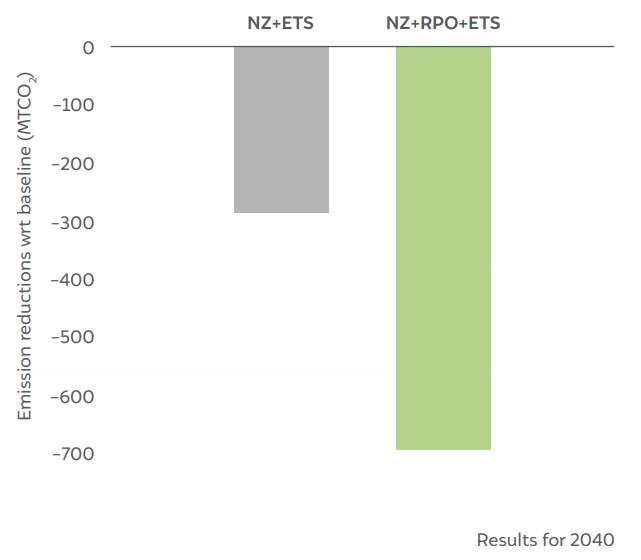
Relative to the baseline, in 2040, the total emission reductions from the RPO (−690 MtCO2 ) are more than 50 per cent higher than the emission reduction in the ETS scenario (−287 MtCO2 ; see Figure 13a). With respect to the NZ scenario, total emissions in the NZ + ETS scenario decrease by ~5 per cent and ~ 17 per cent in the NZ + RPO + ETS scenario (Figure 7).
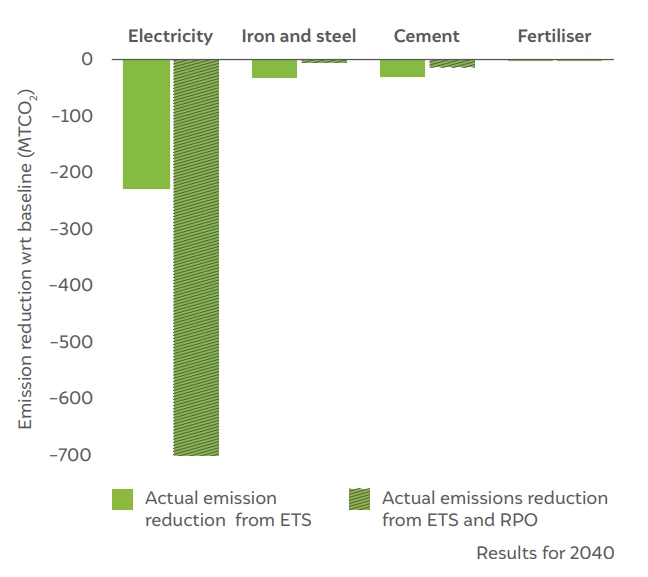
Figure 13b shows that all emission reductions in the RPO scenario happen only in the electricity sector (dashed bars). In comparison, in the NZ + ETS sectors, other sectors also contribute to emission reduction (non-dashed bars). In effect, this implies that the price of carbon will be near zero in the NZ + RPO + ETS scenario, because stringent RPOs make the ETS emission cap non-binding, such that the associated price of carbon goes to zero.
The relative stringency of policies would hence have significant implications for the supply–demand dynamics of the ETS as well as its carbon price.
Figure 13 a) Absolute emission reduction compared to the baseline for the two scenarios – NZ + ETS and NZ + RPO + ETS for the year 2040
Source: Authors’ analysis
Figure 13 b) Emission reductions w.r.t. to the baseline across the four ETS sectors for the two scenarios
Source: Authors’ analysis
Table 2 Description of the different allocation regimes
Source: Authors’ analysis
In the initial phase of an ETS, the government or regulator may set emission intensity targets for different sectors or provide free emission allowances to certain sectors or entities as a way of phasing in the ETS and easing the transition to a carbon-constrained economy. The targets or free allowances are often provided to sectors or entities that are considered to be particularly vulnerable to the costs of emission reduction or where there are concerns about international competitiveness. To explore the effect of different sector targets on financial transfers, we create additional scenario variants with different allocation regimes (See Table 2; see Annexures Section A8 for the exact numbers). Note that the overall ETS cap remains the same across all the scenarios.
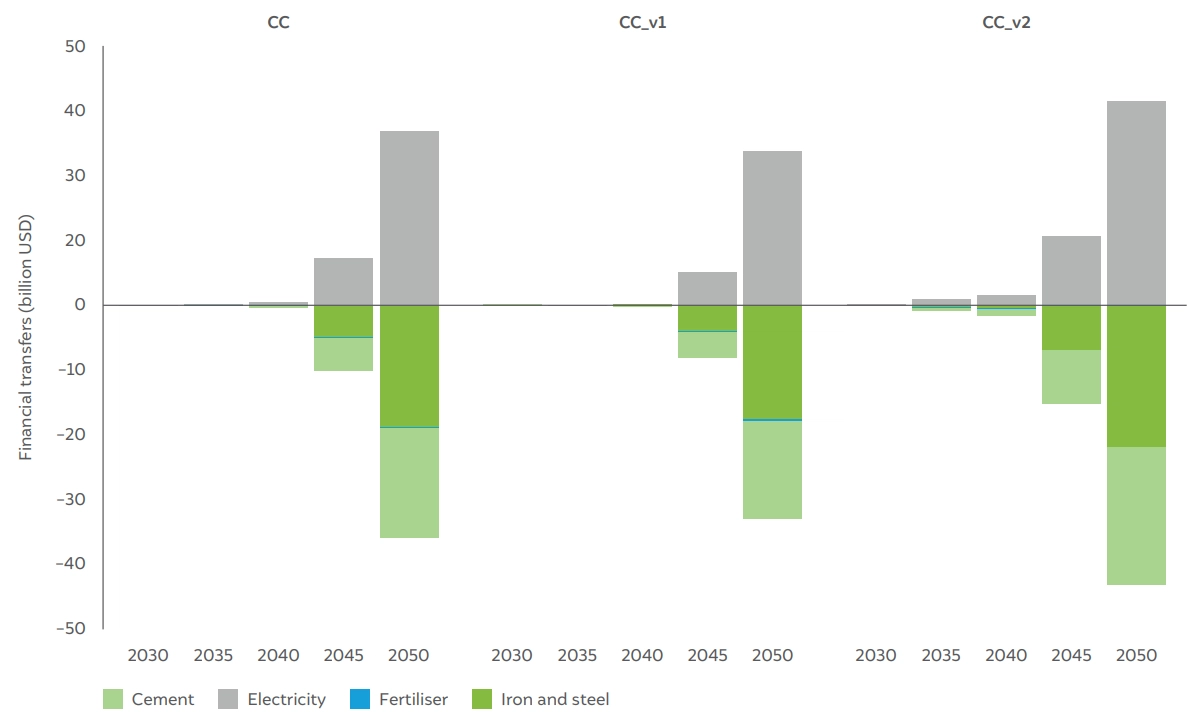
Figure 14 shows that the allocation regimes affect both the direction and quantity of financial transfers. Specifically, in the CC_v1 scenario, the electricity sector is subject to stringent emission targets, resulting in the need to purchase permits from other sectors in the next decade, primarily the iron and steel sector. However, generally, the electricity sector is a net seller of emission allowances, whereas the other three ETS sectors are net buyers. The precise amount of these transfers changes across the different allocation regimes.
Auctioning is a process in an ETS where a certain number of allowances are auctioned in the market by the government or a regulatory body. The purpose of auctioning is four-fold: i) It efficiently allocates permits across the different sectors fairly and transparently; ii) avoids the possibility of windfall profits in certain sectors, i.e., a situation where a sector increases its prices more than the increase in costs from the implementation of a carbon price; iii) generates revenue for the government that can then be used to support research and development of expensive decarbonisation technologies, fund energy efficiency programmes, build low-carbon infrastructures such as charging infrastructure and public transport and support people and regions negatively affected from the energy transition; and iv) strengthens the financial incentive to reduce emissions by requiring entities to pay for their emissions, hence embodying the ‘polluter pays’ principle.
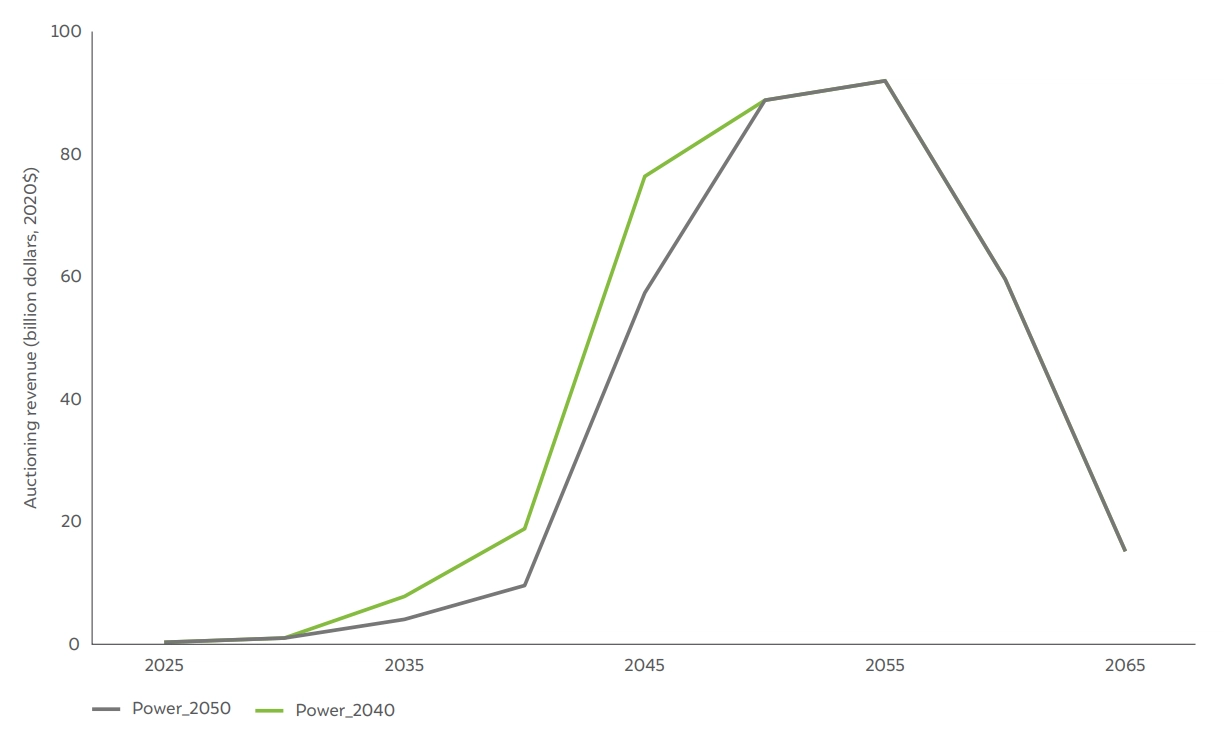
To estimate the potential of auctioning revenue, we consider three off-model ETS auctioning variants: (a) no auctioning; (b) auctioning starting from 2030 only in the electricity sector, initially with a small share of total allowances and then increasing to 100 per cent of allowances until 2040 (‘Power_2040’); (c) similar to (b) except that 100 per cent allowance auctioning in the electricity sector is only reached in 2050, instead of 2040 (‘Power_2050’). In both (a) and (b), there is no auctioning in the industry sector.
The auctioning revenue in any year is the product of the emissions from the electricity sector in the NZ + ETS scenario, the share of emissions that will be auctioned, and the carbon price. Figure 15 shows that although the electricity sector emissions peak in 2040, the auctioning revenue peaks in 2055 – due to a higher carbon price in that year. The auction value depends on the scenario and the year; however, the revenue generated can be significant. For example, in 2045, this value is in the range of USD 65–90 billion.
Figure 14 Financial transfers across sectors (until 2050) under different allocation regimes
Source: Authors’ analysis
Figure 15 Auctioning revenue from the electricity sector under two different off-model scenarios (power_2040, power_2050) for the NZ + ETS scenario
Source: Authors’ analysis
ETS is more cost-effective than equivalent command-and-control policies that do not allow trading across sectors
Several insights emerge from the results. First, in Section 3.3, we showed that an ETS is more cost-effective than equivalent command-and-control policies that do not allow trading across sectors. The magnitude of the cost�effectiveness depends on the allocation targets set for the regulated sectors but potentially also on other factors like the magnitude of the overall cap and the number of sectors covered and their characteristics. Understanding the economic efficiency of a trading-based regulation is important, because policymakers might instead consider setting up specific emission regulations for their own industries because of reasons of administrative practicality (i.e., lower transaction costs) rather than setting up a functioning ETS that requires a much higher level of coordination across sectors to administer the trading platform.
Electricity sector will play a critical role in an ETS
Second, we showed that the electricity sector plays a critical role in an ETS because of its potential to provide large amounts of cost-effective emission reduction options. These mainly include new solar and wind installations that outcompete coal-based generation, with the latter getting progressively more expensive following the discovery of a carbon price. This is unlike the electricity sectors in the US and EU, where coal generation was initially displaced by the availability of cheap gas. The quantity of emission reduction permits that can be supplied by the electricity sector will also depend on electricity demand besides sector-specific targets. For example, a stringent ETS cap combined with low electricity demand would imply that there is limited potential for adding RE in the grid, and, hence, a lower supply of emission reduction permits. In a high-growth economy like India, however, only negative economic growth would imply a lower electricity demand growth trajectory. There is a high likelihood that the electricity sector will continue to supply significant credits unless its sector-specific target is very stringent, as shown in Section 3.7.
The carbon price in an ETS is affected by RPO policies through interaction with the electricity sector
Third, the energy policy in the form of an RPO interacts with the ETS through the electricity sector – which is covered by both policy instruments. Specifically, we showed that the relative stringency between the RPO and the ETS is critical to the success of both these policies. Given the assumptions of this study, the emission reductions required by the ETS up to 2040 can be entirely fulfilled by the electricity sector, since these reductions are mandated by RPOs. In reality, there would be an oversupply of emission permits in the market, which, in turn, would push down carbon prices. Low carbon prices, consequently, would disincentivise industry from implementing in-house mitigation technologies. Past studies have shown that an ETS, coupled with a high feed-in tariff for RE or other renewable support policies, could suppress the carbon price, as these policies would make it much easier for the electricity sector to reduce emissions (Amundsen and Mortensen 2001; Tu and Mo 2017; Weigt, Ellerman, and Delarue 2013) As such, ETS cap-setting needs to consider what emission reductions will be delivered by other policies, including renewable support policies, to avoid being insufficiently ambitious and not driving enough low-carbon action.
Financial transfers across sectors depends on emission allocation as well as the number and characteristics of sectors included in the ETS
Fourth, we showed that the direction and magnitude of financial transfers across sectors in an ETS depend on the allocation of sectoral targets by the government or the regulator. The electricity sector, for example, could become a net seller in the near term if stringent targets are set for it. The setting up of allocation targets is a lengthy process involving extensive consultations and negotiations with industry representatives, including on which allocation methodology to use. Although setting targets has several benefits in the initial phase of implementing an ETS, such as providing clear signalling for industries and assisting those most at risk of carbon leakage through less stringent emission targets, in the longer term, auctioning should be the preferred choice of emission allocation as it efficiently allocates emission caps across sectors and additionally generates revenue for the government.
Auctioning of emission allowances could result in significant revenue for the government
Fifth, the results on auctioning show that the government can earn significant revenue if it decides to auction emission allowances, especially those in the electricity sector. These revenues could be used to finance investments in GHG emission reduction and clean energy technologies in the industrial and electricity sectors, provide compensation to stakeholder groups vulnerable to higher energy prices, reduce the negative impacts of an energy transition, such as the loss of jobs in coal states, pay for the administration and management of the system, and other beneficial purposes. Examples can be found in the ETS implemented globally, which feature auction revenue recycling (e.g., the EU ETS, California Cap-and-Trade, Korea ETS), and other funds financed by ETS including the EU’s Innovation Fund and Modernisation Fund.
Our study does not intend to completely and accurately mimic the Indian carbon market and forecast carbon prices. The objective is to bring some key insights to attention. To this end, we focus only on four sectors, for which sectoral mitigation cost data are available. India’s ETS would cover many more sectors. As of now, these are not part of our analysis, which can be considered a limitation of our study. There are some other critical aspects, like the pass-through effect of carbon prices on electricity prices as well as the prices of industrial commodities. This is an important area of future research.
Given India’s near-term NDC and long-term net-zero targets, the country has announced the introduction of a domestic ETS. The ETS, based on emission intensity targets, is aimed at reducing emissions and spurring low-carbon innovation, especially in the industry sector. In this study, we ran four scenarios (NZ, NZ + ETS, NZ + CC, NZ + RPO) and two scenario variants (NZ + CC_v1, NZ + CC_v2) using the integrated assessment model GCAM to understand the role of the ETS in achieving India’s net-zero target, the interaction between various industrial sectors in an ETS, and the interaction of an ETS with energy policies, specifically RPOs.
The results show that, firstly, the electricity sector has an important role to play in an ETS, not only because of its potential to provide cheap emission credits but also because of its interaction with an ETS through RPOs. A low overall emission-reduction target would lead to a low carbon price. If it remains low over a long period, this would incentivise industrial sectors to buy carbon credits from the electricity sector rather than do ‘in-house’ mitigation or invest in long-term decarbonisation strategies. At the same time, a high carbon price could disrupt industrial activity and lead to strong pushback.
Secondly, different industrial sectors have different capacities to decarbonise. Sectors where fossil fuels are raw materials are harder to abate as their substitutes are either unavailable (like limestone in cement) or expensive (hydrogen in the fertilisers industry). However, most industries do some form of fuel-switching initially (i.e., at a low carbon price), and in later stages, switch to electrification, increased hydrogen use (as electricity becomes increasingly cheaper through greater penetration of renewable energy), and CCS.
Thirdly, an emission cap across sectors (ETS) is cheaper than command-and-control type policies that do not allow trading. This is because in an ETS, mitigation starts with the cheapest options and progresses to more expensive options. In comparison, command-and-control type policies force the regulated sector(s) to mitigation, irrespective of the mitigation costs.
Fourth, auctioning even a part of emission allowances can generate significant revenue for the government, which can be used, for example, to reduce the negative impacts of an energy transition such as the loss of jobs in coal-bearing states.
Lastly, for an ETS to be successful, interactions with other energy policies must be considered. In particular, the impact of RPOs, one of the most stringent policies leading to emission reduction, should be considered when setting the reduction targets of an ETS to avoid potentially negative impacts through the suppression of the carbon price.
Carbon trading, also known as emissions trading or cap-and-trade, is a market-based approach to reducing greenhouse gas emissions, particularly carbon dioxide (CO2) emissions, which are a major contributor to climate change. In a carbon trading scheme, the government or regulatory authority sets a limit or cap on the total amount of carbon emissions that can be released into the atmosphere. This cap is often allocated as a certain number of emissions permits or allowances. Companies or entities that emit carbon are required to hold a sufficient number of permits to cover their emissions. If a company's emissions exceed the number of permits they hold, they must buy additional permits from other companies or entities with excess permits. Conversely, if a company's emissions are below their permit allocation, they can sell their excess permits to others.
An emissions trading scheme establishes a cap on allowable greenhouse gas emissions and allocates or auctions permits to emitters. These emitters are required to hold enough permits to cover their emissions. Permits can be traded in a market, creating incentives for emissions reduction and helping achieve environmental goals.
Examples of an emission trading scheme include the EU-ETS (one of the most well-known carbon trading schemes), the California Cap-and-Trade Program, Regional Greenhouse Gas Initiative (RGGI) (RGGI is a cap-and-trade program in the northeastern United States, focused on reducing CO2 emissions from power plants), the South Korea Emissions Trading Scheme, and the China ETS (which hosts the world's largest carbon market by emissions).
Carbon credits are generated in a carbon crediting mechanism or an offset-market. A carbon crediting mechanism is a system where transferable credits, usually equivalent to one metric ton of carbon dioxide, are produced from voluntary efforts to reduce or remove emissions. This mechanism contrasts carbon taxes and Emission Trading Schemes (ETS). Instead of making businesses pay for their emissions (following the polluter pays principle), this mechanism allows businesses and organisations to earn carbon credits and generate revenue by showing that they have effectively reduced or captured emissions compared to a predetermined baseline scenario.
Emissions trading in India offers several advantages. Firstly, it promotes efficient emissions reduction by allowing industries to find cost-effective ways to meet their targets. This approach incentivises the development and adoption of green technologies, fostering innovation and sustainable industrial growth. Secondly, it can help India achieve its near-term NDC targets and long-term net-zero emissions. Thirdly, although India's current emission trading scheme does not include auctioning, at a later stage when auctioning might become the preferred choice of emission allocation, the revenue generated through allowance auctions can be reinvested in clean energy and sustainable development projects. Lastly, emissions trading can integrate India with international carbon markets, facilitating global collaborations in the fight against climate change.
According to ICAP’s report on “Emissions Trading Worldwide: 2022” As of the start of 2022, there are 25 operational emissions trading systems around the world, in jurisdictions representing 55% of global GDP.
India currently does not have an ETS but the Government of India is planning to establish an ETS, called the Carbon Credit Trading Scheme, which is expected to be operational in the financial year 2024-2025.
Carbon taxes and emission trading schemes (ETS) are two distinct approaches to pricing carbon emissions and incentivising their reduction. Carbon taxes set a fixed price per unit of emissions, while emission trading schemes (ETS) establish emissions caps and permit trading. Carbon taxes provide price certainty but not emission level certainty, generating government revenue directly. ETS ensures emission level certainty but allows price fluctuations, generating revenue through permit auctions and trading. The choice depends on the balance between price predictability and emissions reduction certainty.
How can Carbon Markets Scale Durable Carbon Dioxide Removal in India?

Sustainable rice cultivation in India
EU Carbon Border Adjustment Mechanism
Roadmap for a Net-Zero Power Sector in Gujarat