Council on Energy, Environment and Water Integrated | International | Independent
Suggested citation: TNGCC and CEEW. 2024. Tamil Nadu’s Greenhouse Gas Inventory and Pathways for Net-Zero Transition. Chennai: Tamil Nadu Green Climate Company, Department of Environment, Climate Change and Forest, Government of Tamil Nadu; and Council on Energy, Environment and Water (CEEW).
With a gross state domestic product (GSDP) of INR 23.64 lakh crore in 2022–23, Tamil Nadu (TN) contributes nearly 10 per cent to India’s overall gross domestic product (GDP). As a leading industrial state, it has an ambitious target of becoming a USD 1 trillion economy by 2030–31. Given that TN is a growing economy with a stabilising population, its energy needs are also expected to significantly increase in the future, notably in key sectors such as transport, industry and building. In this context, the Government of Tamil Nadu embarked upon an exercise to develop the state’s long-term net-zero (NZ) emissions transition plan. TN undertook a scientific and rigorous energy systems modelling exercise to inform the state’s vision and sectoral pathways to achieve NZ emissions.
Climate change impacts are increasingly being felt worldwide, and emissions mitigation commitments by countries and companies have picked up the pace. This has been especially true since the release of the Intergovernmental Panel on Climate Change (IPCC) special report on the impacts of global warming of 1.5°C above pre-industrial levels that called for achieving global net-zero (NZ) emissions by the middle of the century (Fischlin et al. 2018). At the 26th session of the Conference of the Parties (COP26) in 2021, India demonstrated its climate leadership by announcing that it would achieve NZ carbon emissions by 2070. This will require significant transformation across key sectors that produce and consume energy, such as agriculture, industry, power, transport, building and waste. Each state in India will have distinct low-carbon transition pathways depending on its current level of economic development, resource availability, and socio-political context. As a developing economy, Tamil Nadu (TN) is bound to witness increased economic growth in the near future, resulting in higher per-capita income and urbanisation levels, which will further lead to increased energy demand and emissions across sectors contributing to the economy. The challenge for TN, then, is to identify and chart out decarbonisation pathways for the aforementioned sectors, while not compromising on the prospects of economic growth. In addition, TN will need to identify and nurture technologies and financing that will enable its NZ transition. A commitment to NZ emissions, therefore, requires consistent efforts to adopt low-carbon pathways across various sectors in the near, medium, and long term. Our analysis based on the latest greenhouse gas (GHG) inventory and long-term projection for emissions in business as usual (BAU) and NZ scenarios reveals important trends and provides the following significant insights.
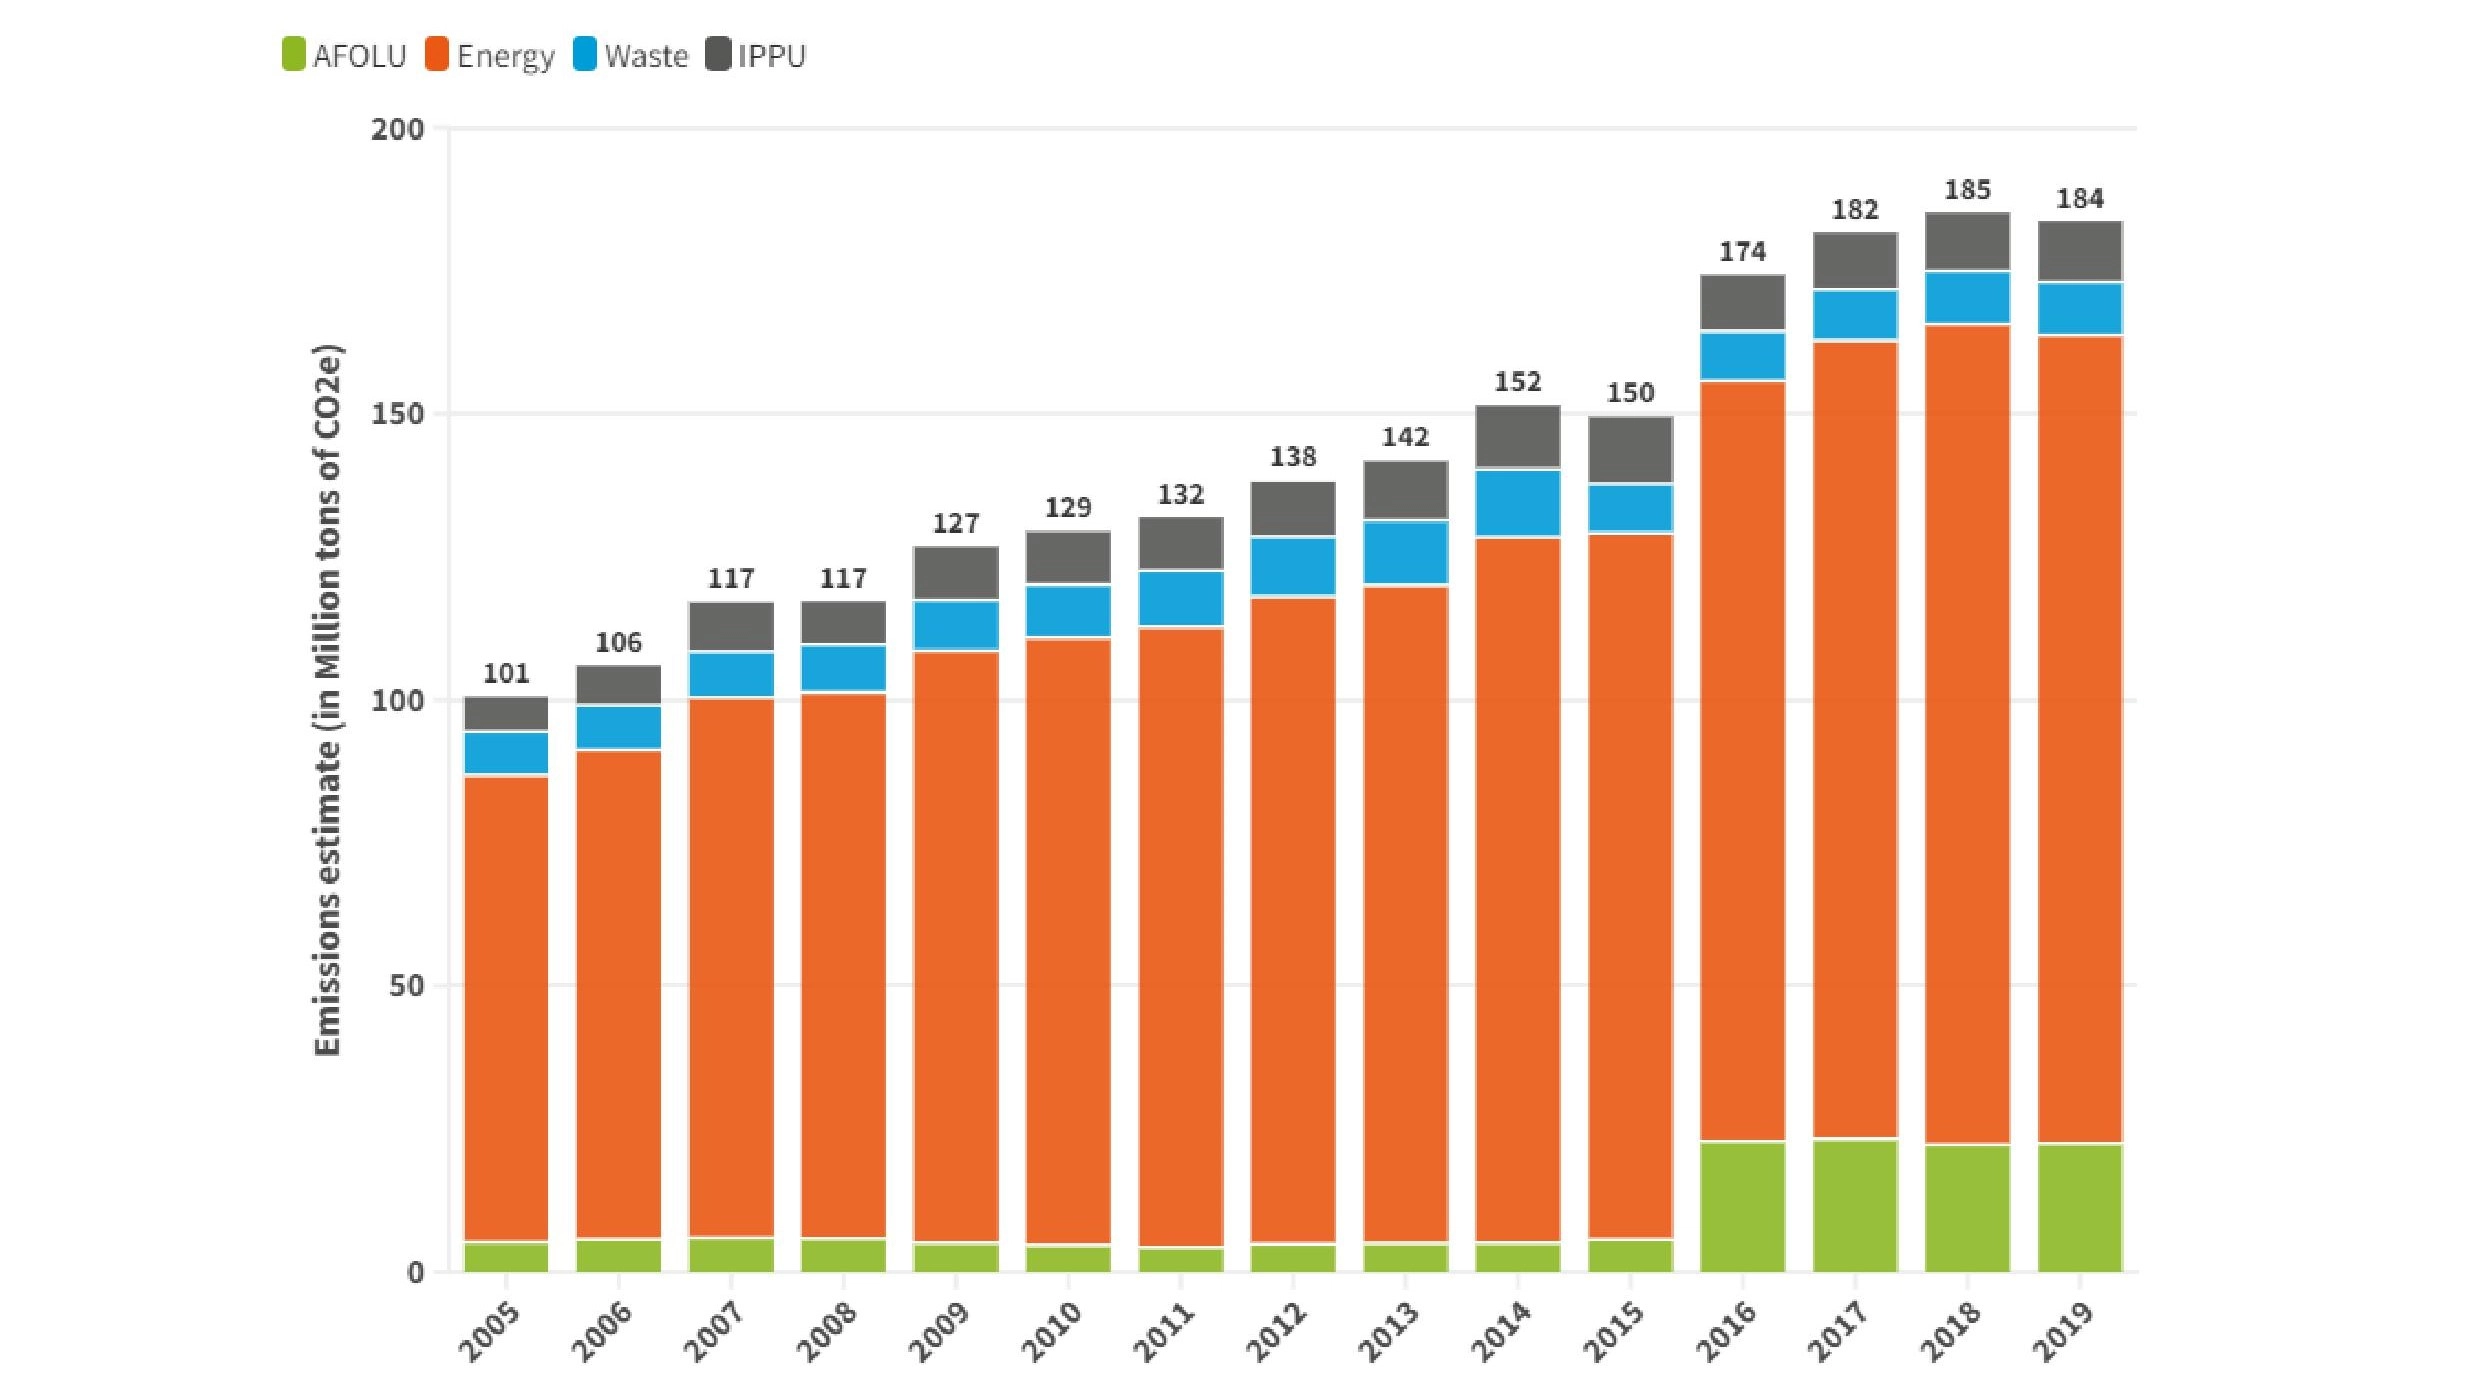
From around 100 Million tons of Carbon di-oxide Equivalent (MtCO2eq) in 2005, TN’s overall GHG emissions rose to 184 MtCO2eq in 2019. In this year, the state’s energy sector accounted for 77 per cent of the total emissions at 141 MtCO2eq. Other key sectors include the Agriculture, Forestry and Land Use (AFOLU) sector emitting around 22.5 MtCO2eq, accounting for around 12 per cent of the overall emissions, followed by the Industrial Processes and Product Use (IPPU) and Waste sectors at approximately 11 MtCO2eq and 9.5 MtCO2eq, accounting for around 6 per cent and 5 per cent each.
NZ ambition entails reducing GHG emissions across key energy producing and consuming sectors. The face of mobility will change from fossil-based to low-carbon mobility, necessitating a significant change in the automobile industry set up. Industrial energy use will have to be largely electrified, having implications through pass through of electricity prices. Rapid renewable energy penetration will present significant opportunities for investment and job creation. Therefore, it is critical to view NZ transition as a larger economic transformation that has profound implications for the future economy of TN.
Peak year is defined as the year in which absolute economy-wide emissions peak, following which there will be a continuous drop in emissions. Given the diverse economic profiles of various states in India, the shape of emissions pathway for various states, including at what level and which year they will peak, would be different. Understanding this critical milestone is critical for various stakeholders in the state.
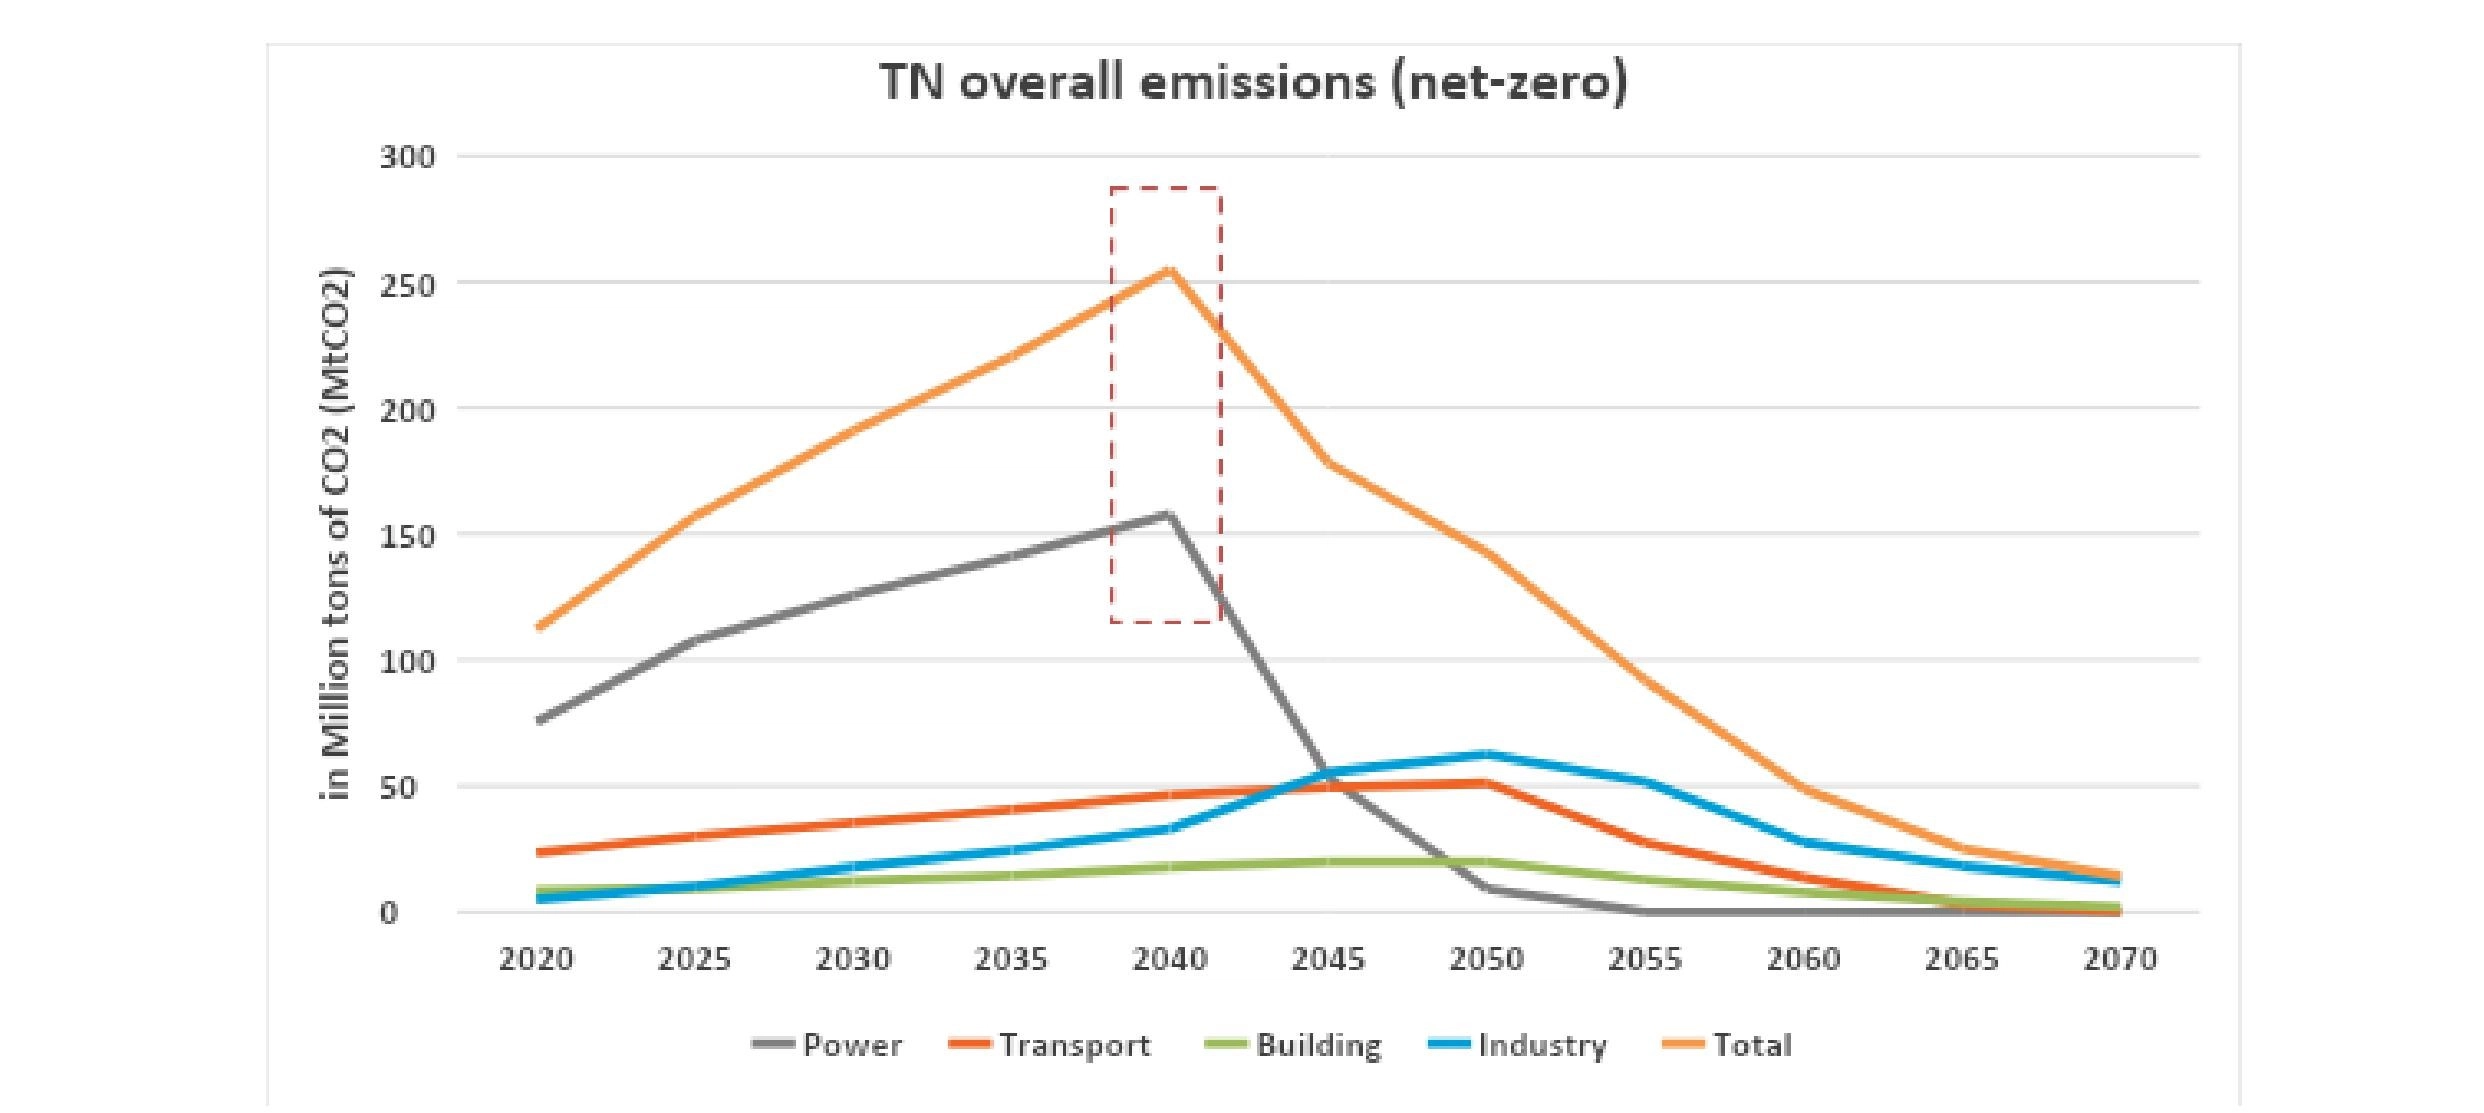
Overall CO2 emissions in the BAU (a) and NZ (b) scenarios
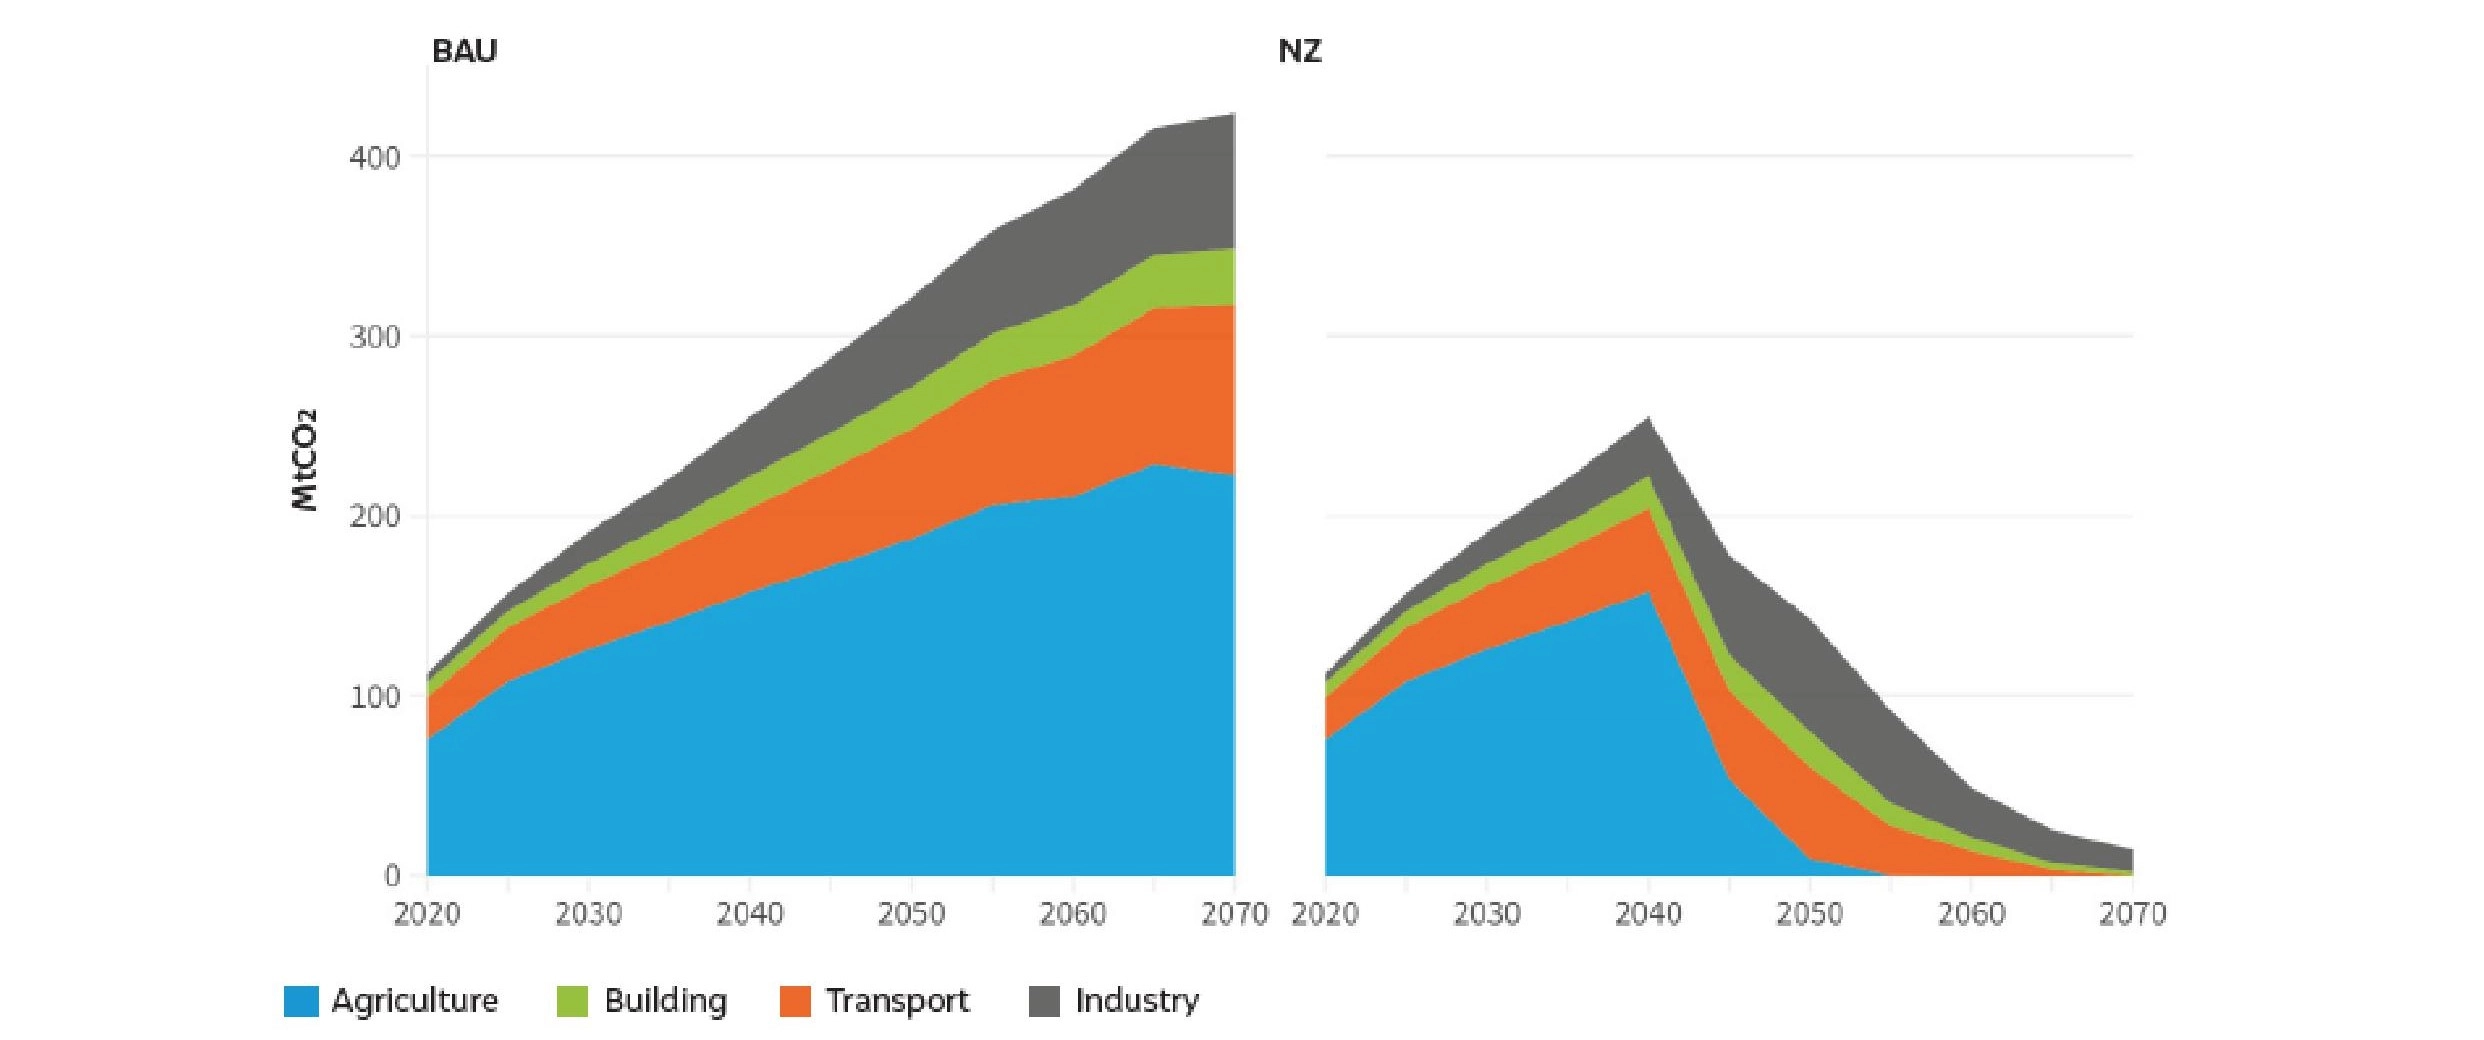
Source: Authors’ analysis
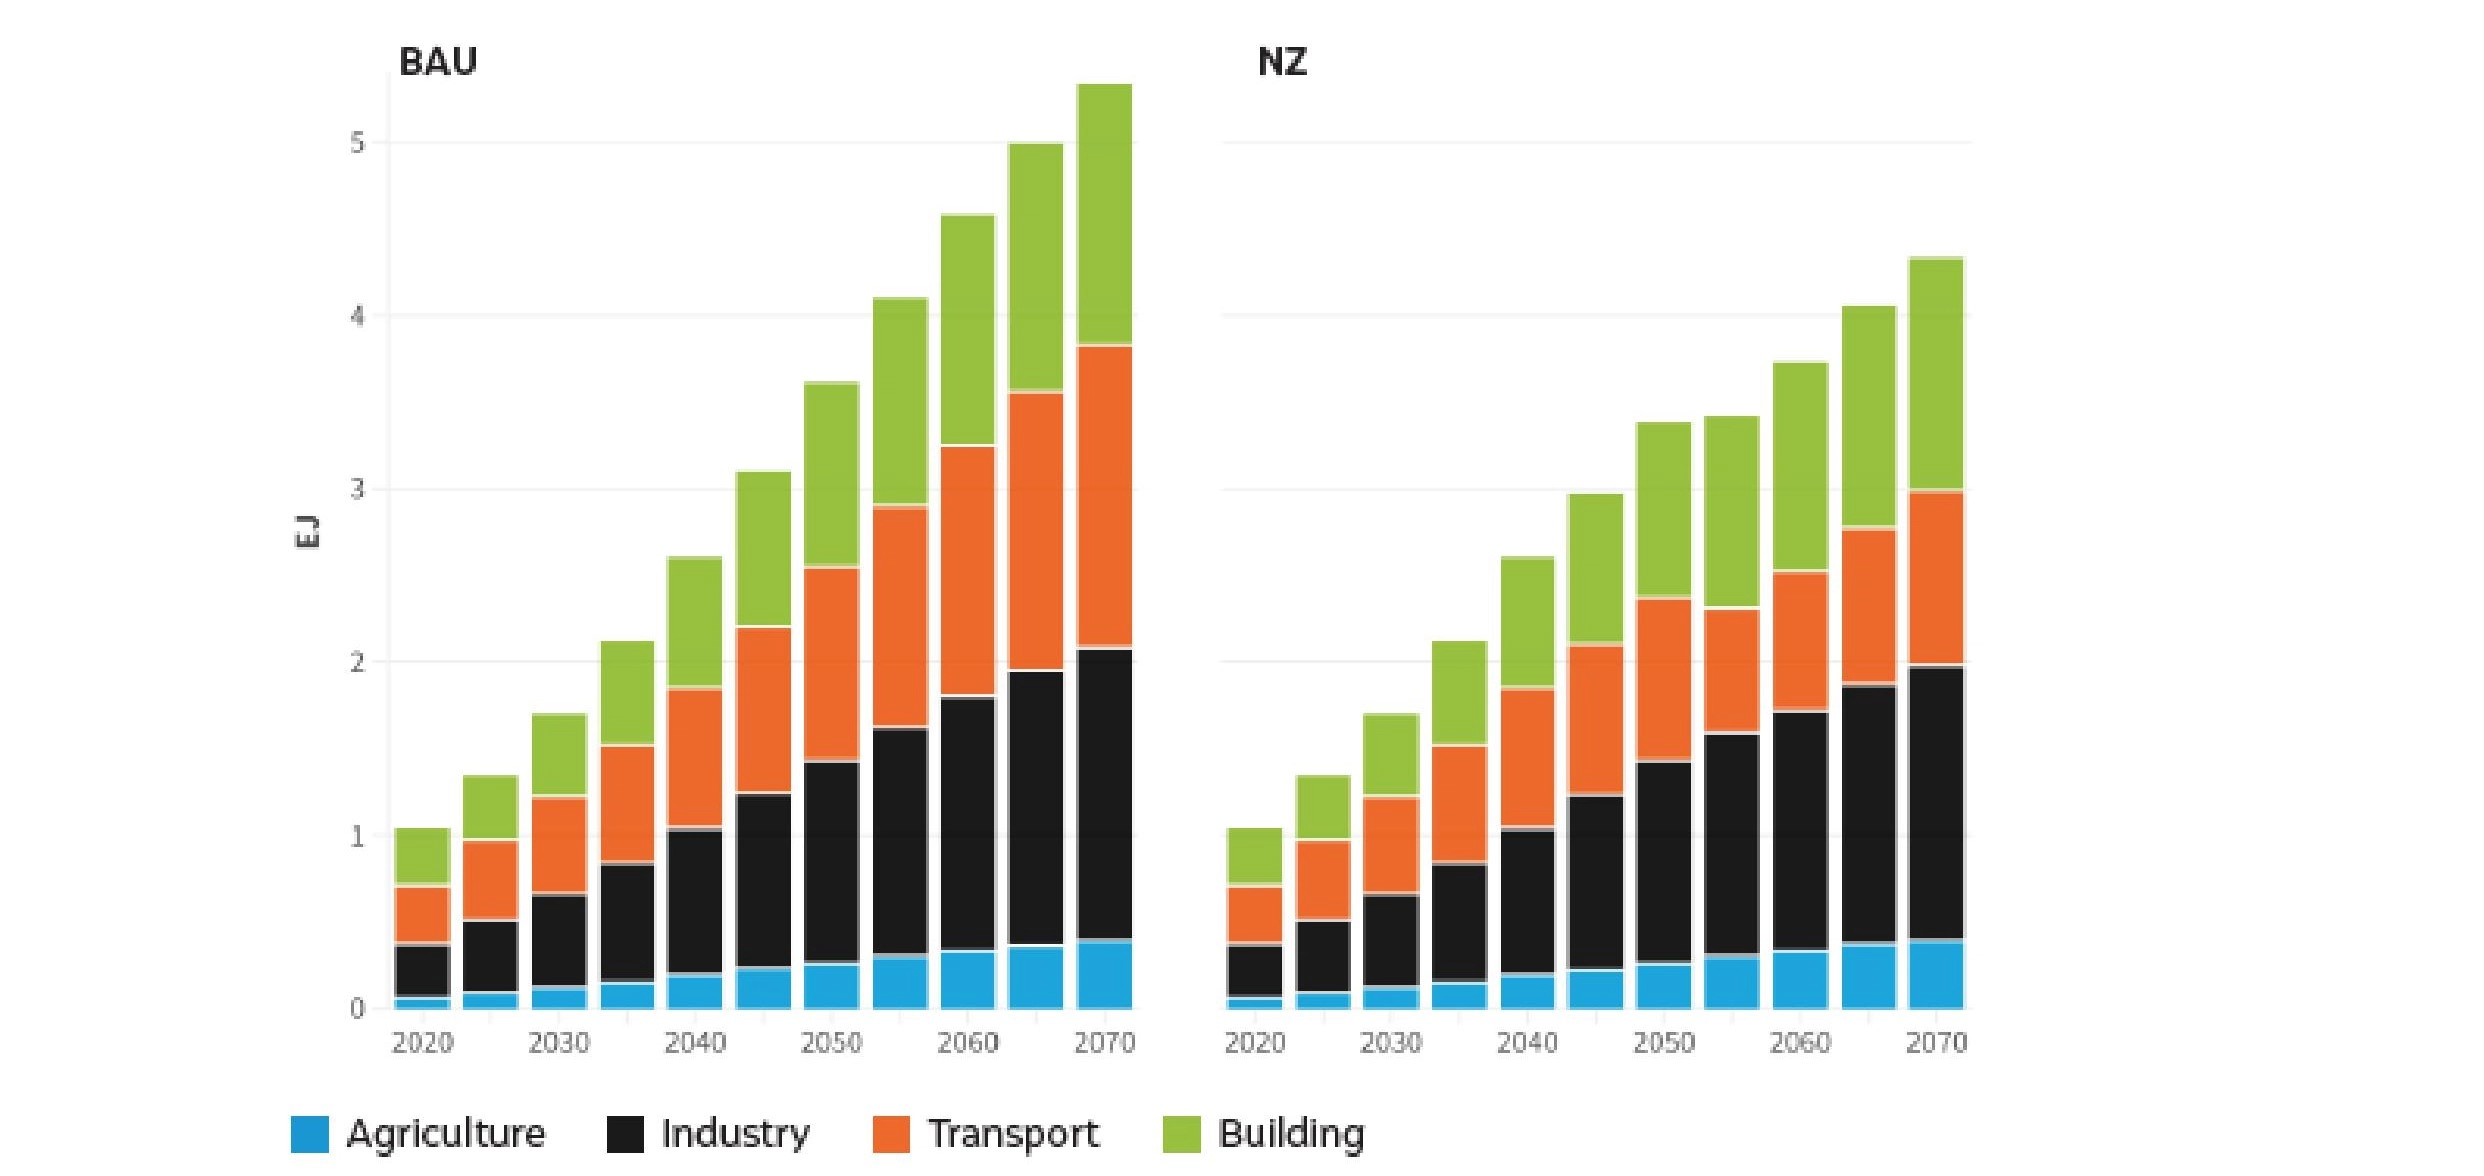
A net-zero scenario necessitates electrification of the various end use sectors. Total electricity consumption in 2070 Tamil Nadu in the NZ scenario is 75% higher than that in the BAU scenario. In 2020, the building and industry sectors in the state consume about 44 per cent and 42 per cent of the total electricity respectively, while agriculture accounts for 13 per cent, and the transport sector accounts for a negligible 1 per cent. In projections for the future, the electricity demand for NZ emissions is higher for all sectors, and transport sees an exponential growth, accounting for 24 per cent of the share in 2070. Therefore, this key insight pertains to the criticality of the power sector and the imperative to significantly ramp up renewable generation capacity to meet growing consumption needs.
Electricity consumption, by sector, in the BAU (a) and NZ (b) scenarios
Source: Authors’ analysis
Our assessment shows that significant efficiency gains are obtained from the large-scale electrification of end-use sectors. In addition, dedicated interventions to enhance energy efficiency across sectors will have to be undertaken. Compared to 2020, the energy intensity of TN’s GSDP has to reduce by 24 per cent in 2030 and 55 per cent in 2050 to achieve NZ emissions. TN’s total electricity consumption for 2020–21 stood at around 110 BUs. Electrification and energy efficiency gains imply mean annual energy savings in 2070 could be equivalent to nearly three times that of current electricity consumption.
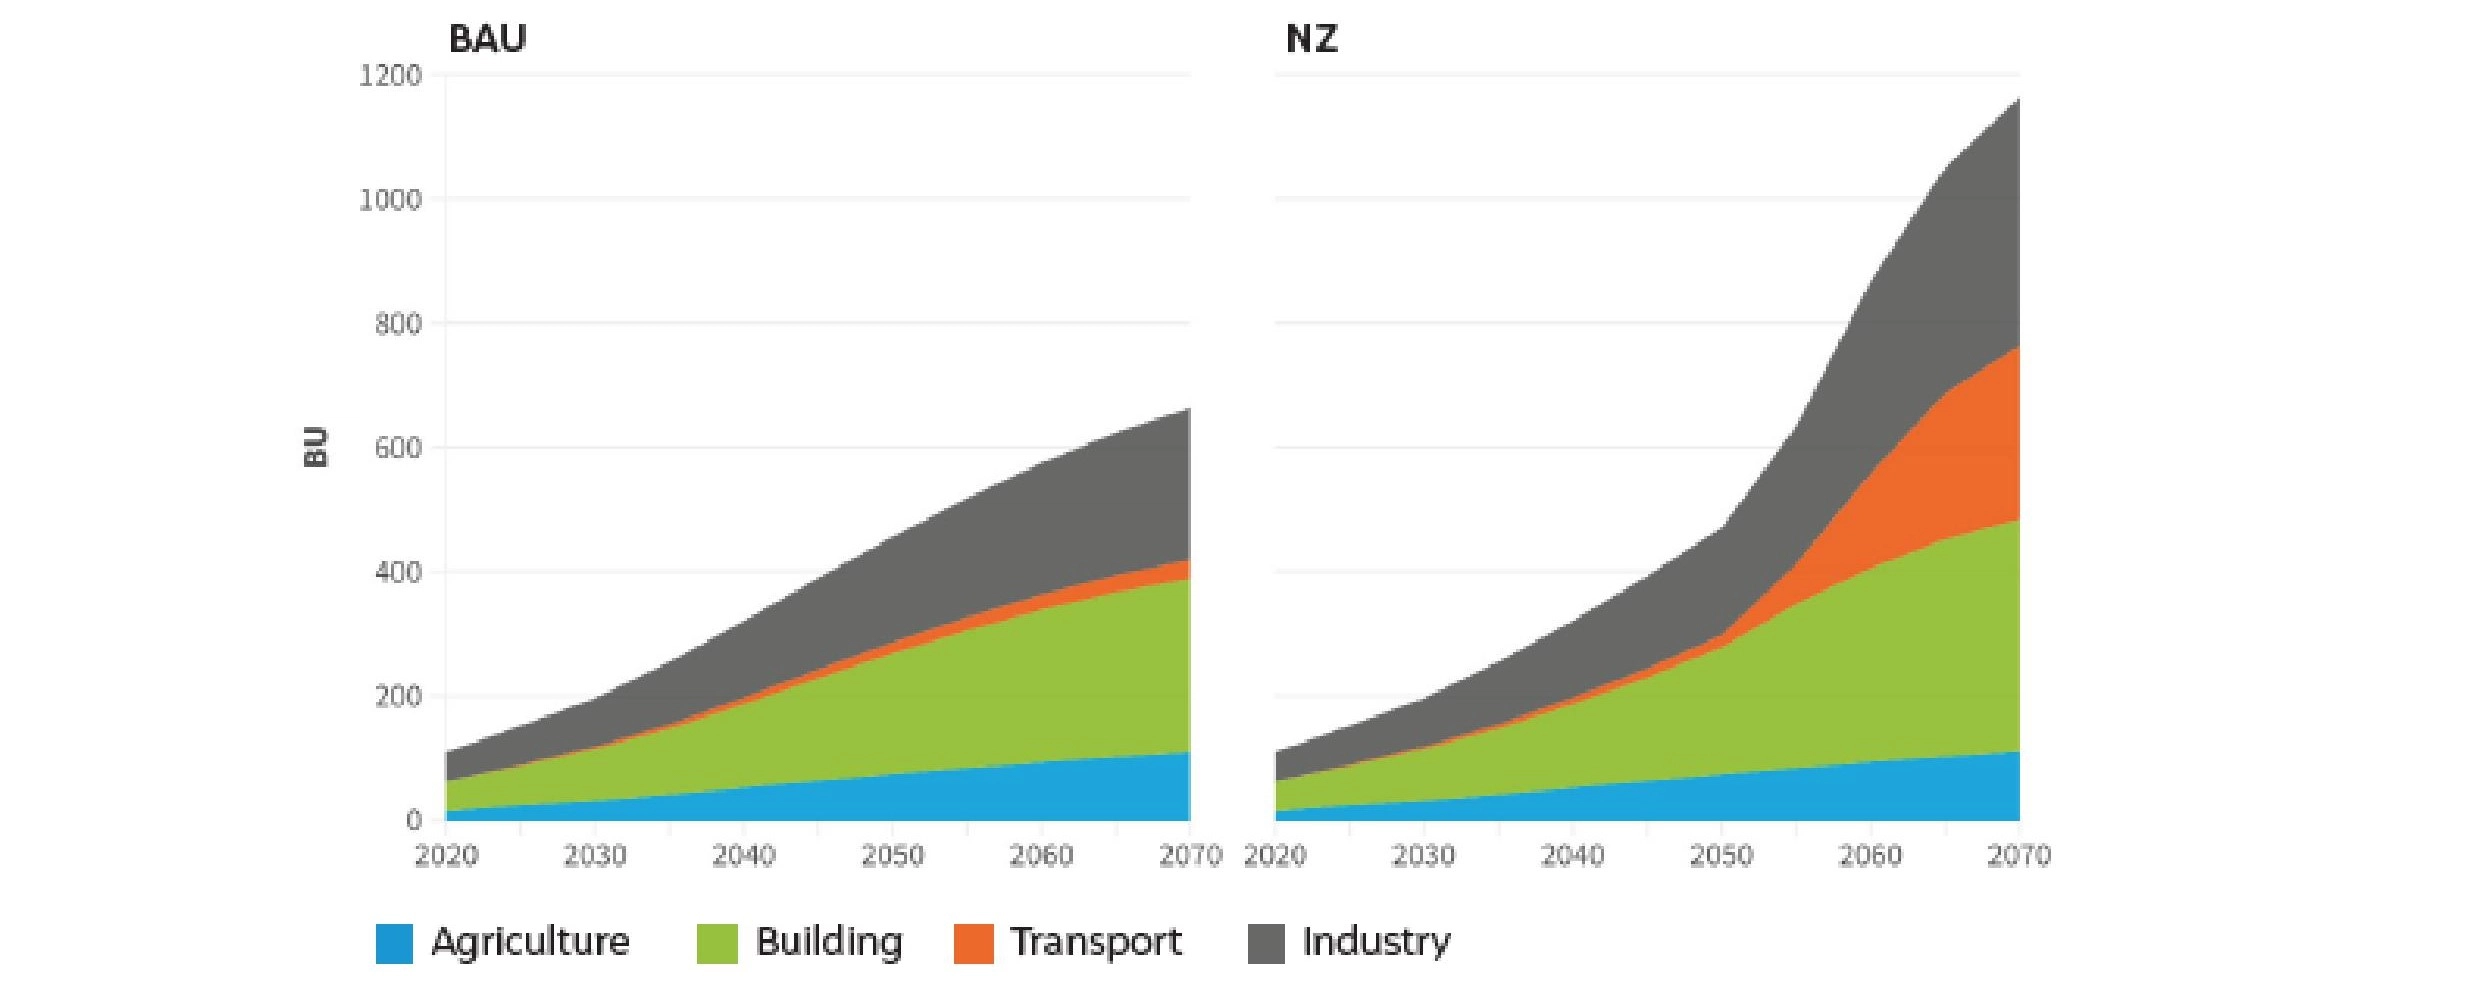
Final energy demand, by sector, in the BAU (a) and NZ (b) scenarios
Source: Authors’ analysis
In the NZ scenario, power sector emissions are projected to peak at around 157 MtCO2 in 2040, followed by the building sector at 20 MtCO2 in 2045, and the transport and industry sectors at nearly 62 and 50 MtCO2 in 2050, respectively. This signifies that the power sector holds the highest emissions mitigation potential and is key for other end-use energy consumption sectors to successfully decarbonise, given the extent of electrification observed in the NZ scenario. It is imperative that early focus of decarbonisation efforts is in the power sector, where many technologies are already cost competitive.
Our assessment indicates that TN will need to procure power from outside the state in the future in both the NZ and BAU scenarios. The need for electrification of the end use sectors to achieve the goals of net-zero necessitates the need for significant renewable energy capacity addition over the coming decades. It requires TN to add around 9 GW of solar capacity and 2 GW of wind capacity on average every year, with capacity addition growing at compounded annual growth rates (CAGRs) of 8 and 4 per cent, respectively, for solar and wind. According to TN’s energy policy note from 2023–24, one of the targets is to increase the installed capacity of solar to 20 GW over a period of 10 years, indicating that the state is on track in the near term to achieve NZ emissions in the long term. The Ministry of New and Renewable Energy (MNRE) has conservatively estimated that 17 GW of solar capacity can be obtained using 3 per cent of wasteland area (PIB, 2024). However, other estimates indicate that there is much greater potential, which has to be reassessed in the light of the net-zero target.
Electricity generation, by fuel, in the BAU (a) and NZ (b) scenarios
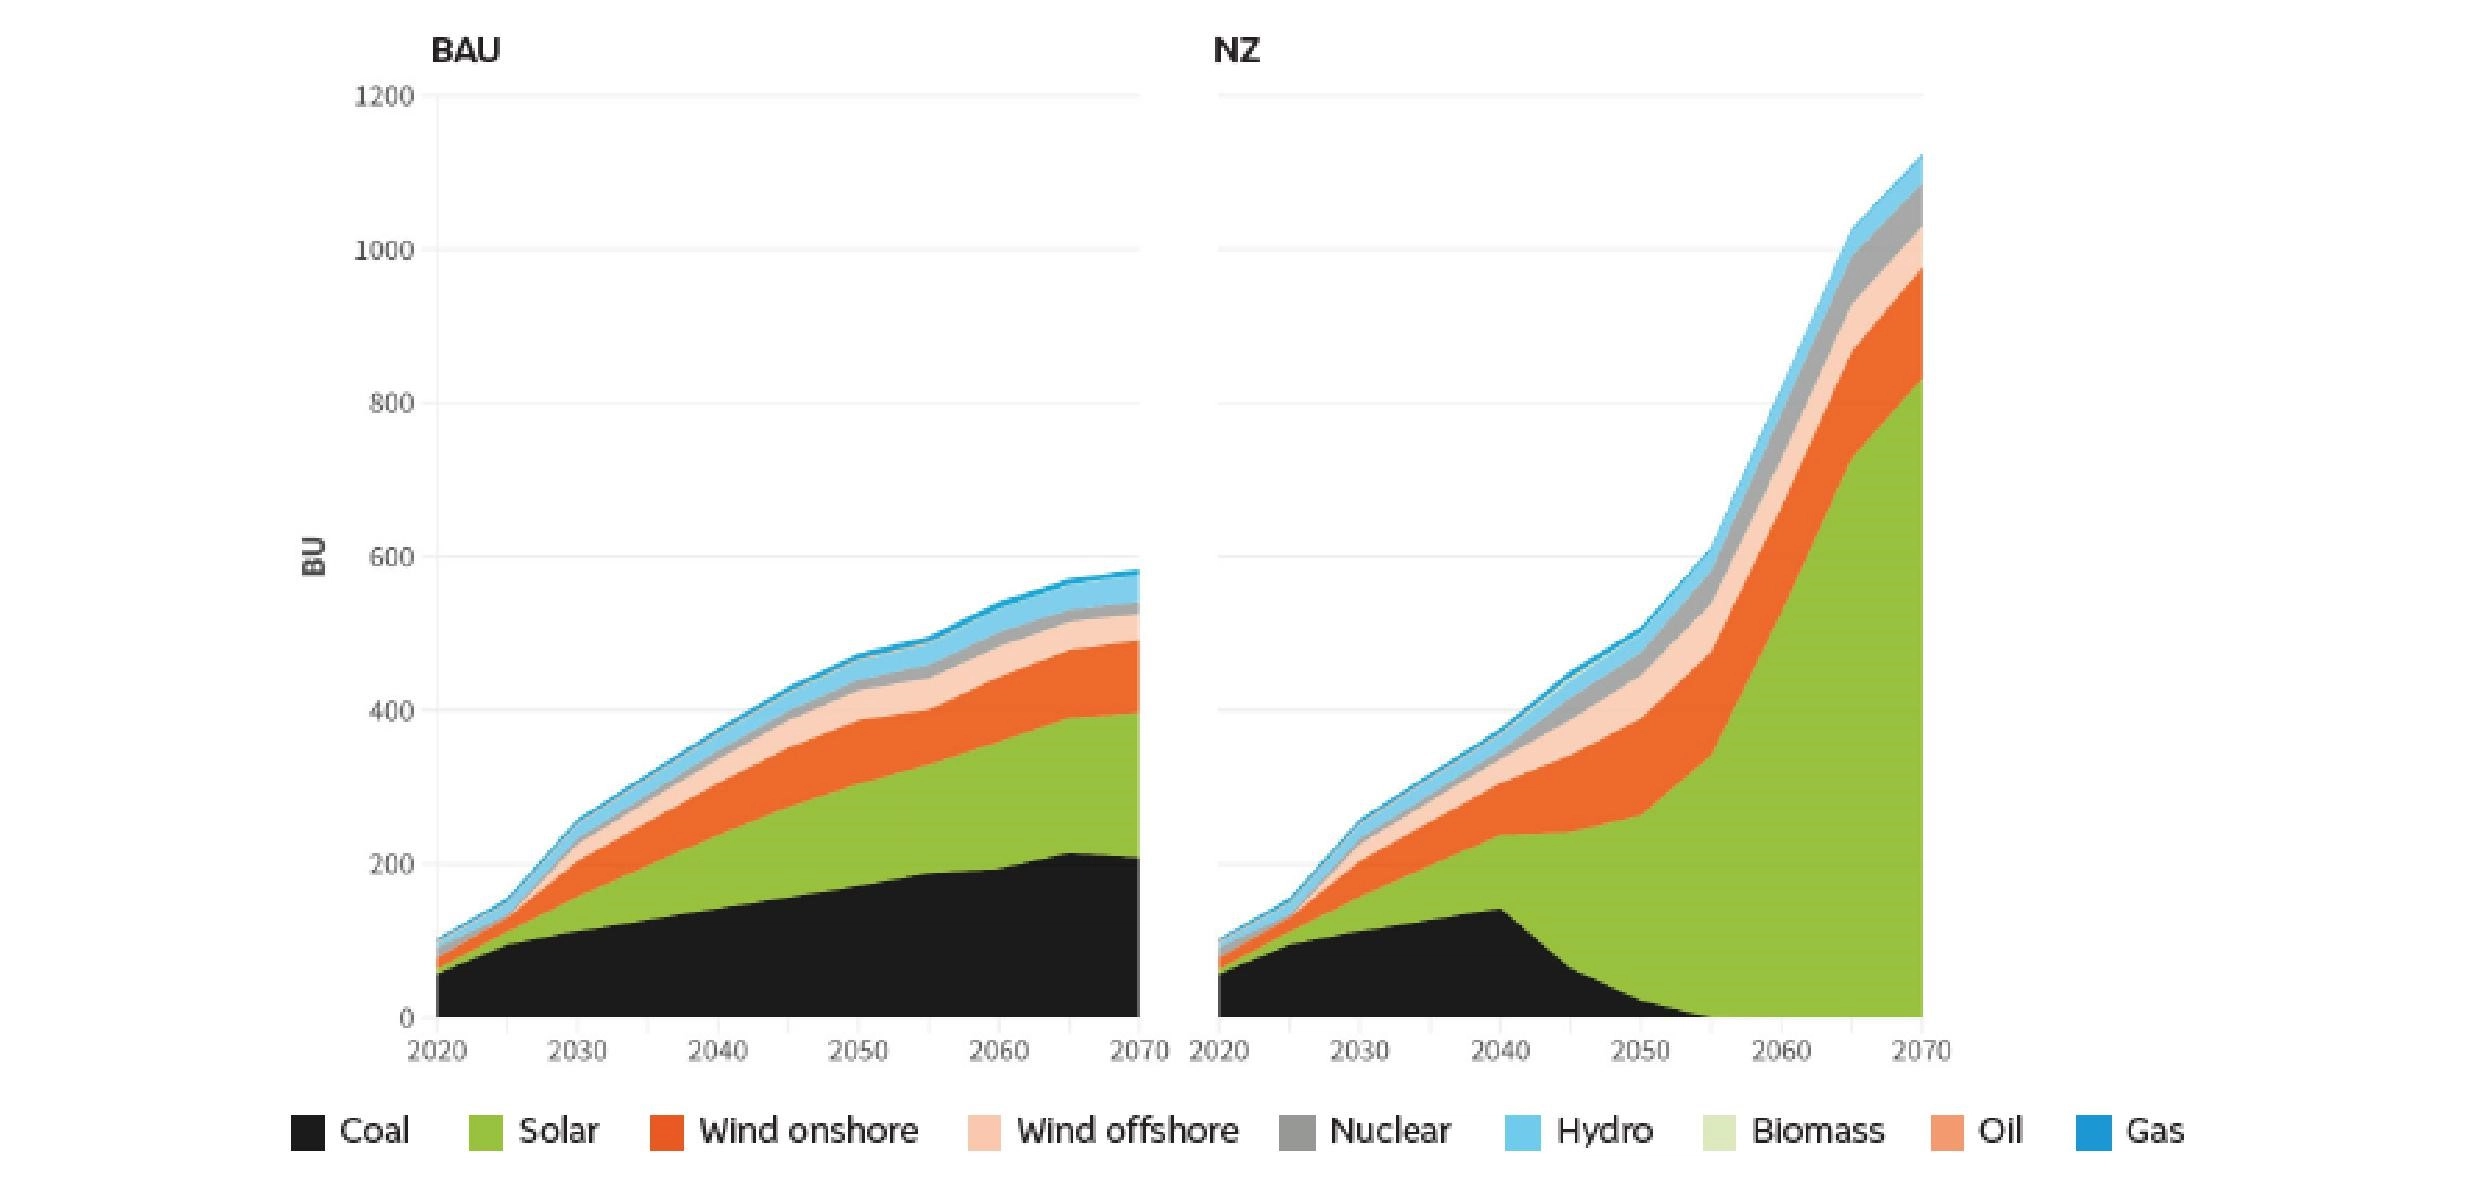
Source: Authors’ analysis
While it is necessary to increase both solar and onshore wind power capacity in the future, offshore wind power must start contributing to clean energy generation. While India currently does not have any offshore wind power plants, the National Institute of Wind Energy (NIWE) identified that there is potential to harness about 70 GW from offshore wind, spread across 16 offshore zones along the coasts of TN and Gujarat. The MNRE aims to bid out 37 GW worth of capacity by 2030. In 2023, the MNRE published an updated strategy paper and a tender for allocating seabed areas to develop 7 GW of open access–based or captive offshore projects off the TN coast. This could potentially help reduce the emissions footprint of commercial and industrial electricity consumers. Offshore wind, therefore, remains an important untapped source of energy in TN.
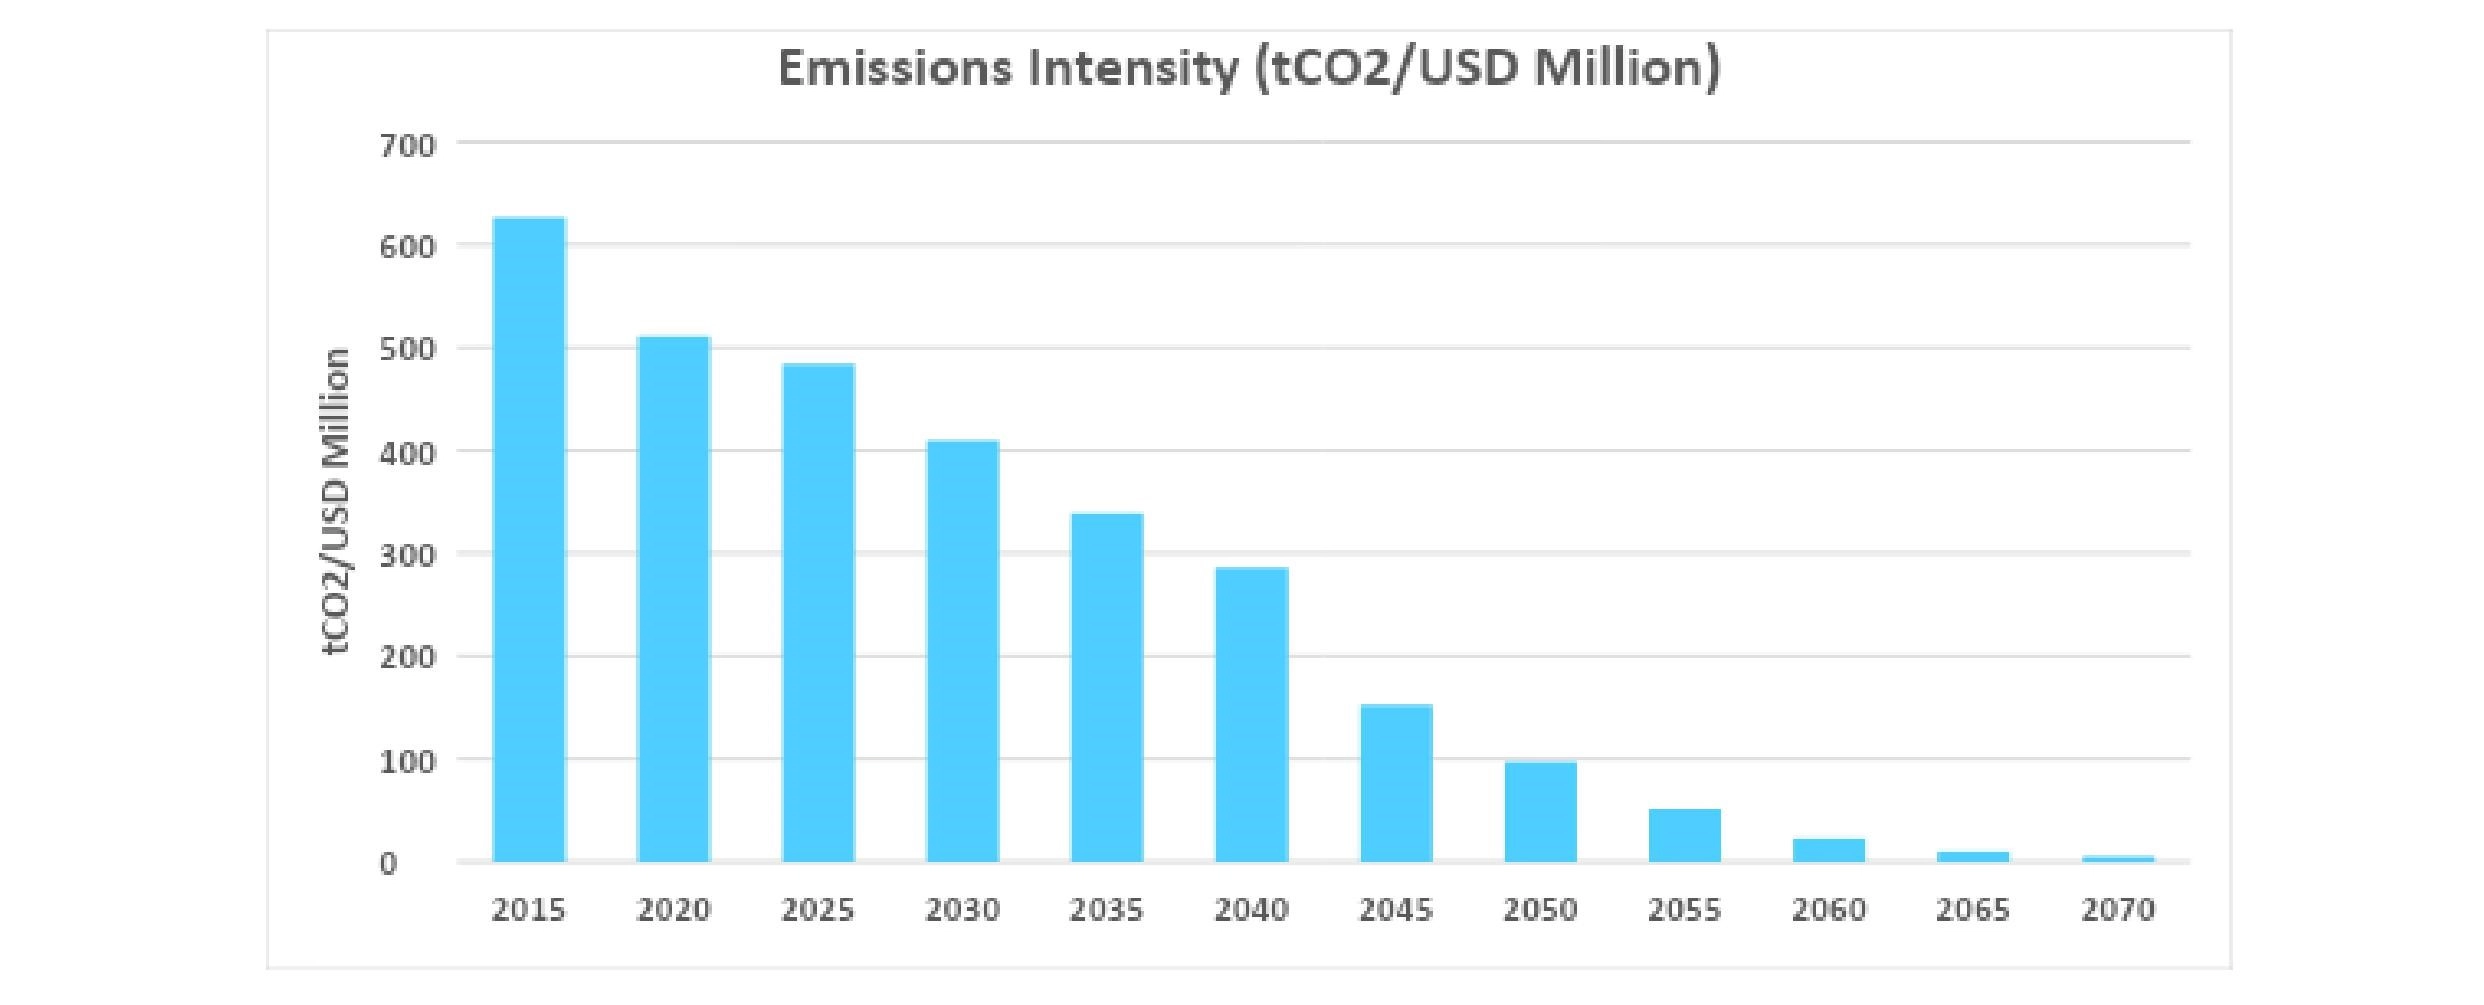
Emission intensity measures the amount of GHGs released per unit of economic output. India’s NDC aims to reduce the emission intensity of the gross domestic product (GDP) by 45 per cent from the 2005 level (Government of India 2022). In this context, based on the modelling results, TN needs to reduce its emission intensity by 46 per cent in 2030 and by a further 87 per cent by 2050, compared to 2005 levels, to achieve NZ emissions by 2070. For context, in 2020, for every USD 1 million of TN’s gross state domestic product (GSDP), the state’s energy sector emitted nearly 510,000 tCO2. This Tamil Nadu’s Greenhouse Gas Inventory and Pathways for Net-Zero Transition 3 has to be reduced to about 410,000 tCO2 in 2030 and 100,000 tCO2 in 2050.
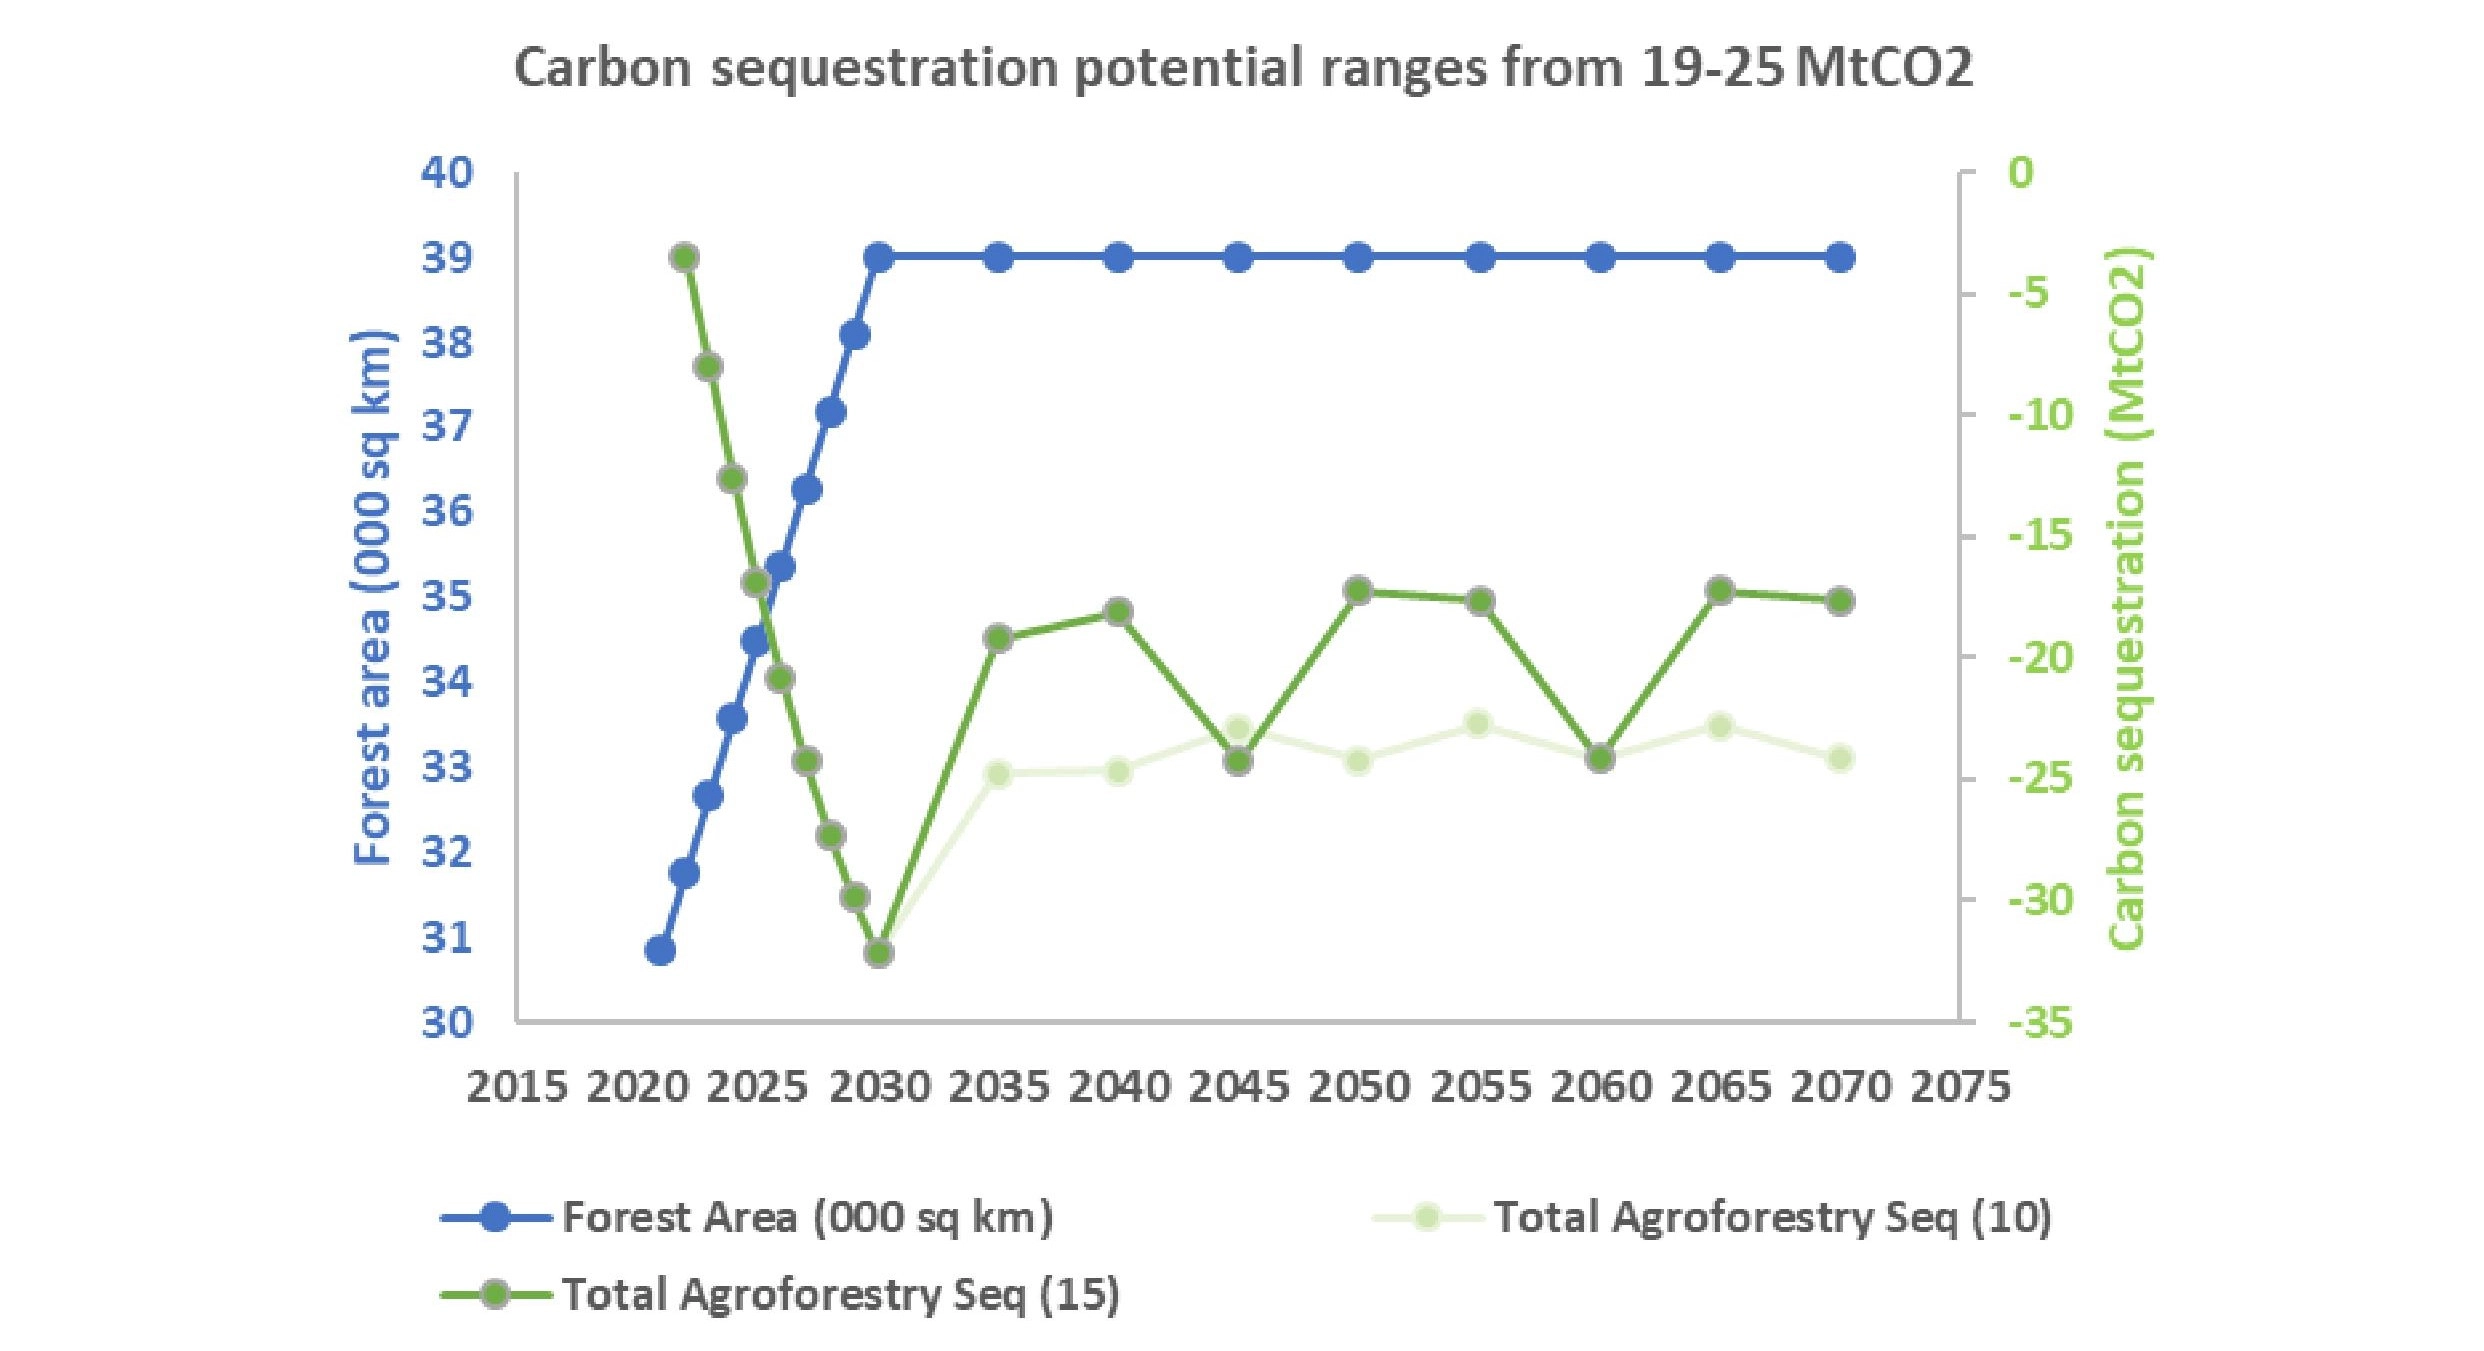
A comprehensive study of one of TN’s flagship missions, the GTN Mission, reveals that the GTN Mission is capable of sequestering emissions to the tune of 19–25 MtCO2 per annum. The average annual carbon sequestration potential is 19 MtCO2 for a tree rotational period of 15 years, and this goes up to 25 MtCO2 for a rotational period of 10 years. Carbon sequestration through trees will have to be an important part of the strategy to achieve net-zero for the state.
Tamil Nadu (TN) saw an 84 per cent rise in overall GHG emissions between 2005 and 2019. From around 100 million tons of carbon dioxide Equivalent (MtCO2eq) in 2005, TN's overall GHG emissions rose to 184 MtCO2eq in 2019. In this year, the state’s energy sector accounted for 77 per cent of the total emissions at 141 MtCO2eq. Other key sectors include the Agriculture, Forestry and Land Use (AFOLU) sector emitting around 22.5 MtCO2eq, accounting for around 12 per cent of the overall emissions, followed by the Industrial Processes and Product Use (IPPU) and waste sectors at approximately 11 MtCO2eq and 9.5 MtCO2eq, accounting for around 6 per cent and 5 per cent each.
At the TN Climate Summit 1.0 held in December 2022, the Chief Minister of TN, Mr. M. K. Stalin, announced that the state will achieve net-zero emissions (NZ) ahead of India’s target of 2070. This commitment was reiterated by Mr. Udhayanidhi Stalin, Minister of Youth Welfare and Sports Development, at the TN Climate Summit 2.0 held in February 2024. CEEW’s analysis suggests continuous effort to mitigate emissions from the energy sector combined with increased ambition to improve the forest and tree cover as part of the Green Tamil Nadu Mission could potentially enable TN to achieve NZ before 2070.
The Green Tamil Nadu (GTN) Mission is one of the four flagship climate change missions of the Government of Tamil Nadu, the other three being the TN Climate Change Mission, the TN Wetlands Mission and the TN Sustainably Harnessing Ocean Resources and Blue Economy (SHORE) Mission. The GTN Mission aims to increase TN’s tree and forest cover from 23.7 per cent in 2021 to 33 per cent by 2030-31 through new plantation activities and restoration of degraded forest land.
CEEW’s analysis suggests that for Tamil Nadu to achieve NZ by 2070, the state needs about 475 GW of installed solar capacity and 90 GW of installed wind capacity (including both onshore and offshore wind). Note that these projections are based on the evolution of the cost of electricity generation technologies and certain key socio economic indicators such as population growth, gross state domestic product, per capita income and urbanisation. Refer to the Annexure in the report for further details on electricity generation costs across various technologies and socio economic trends in the state.
How can Carbon Markets Scale Durable Carbon Dioxide Removal in India?
Sustainable rice cultivation in India
Roadmap for a Net-Zero Power Sector in Gujarat
EU Carbon Border Adjustment Mechanism