Council on Energy, Environment and Water Integrated | International | Independent
Suggested Citation: Gupta,V., T. Biswas, and K. Ganesan. 2017. Greenhouse Gas Emission Estimates from Manufacturing Sector in India at the Subnational Level (Version/edition 2.0). New Delhi. GHG Platform India Report - Council on Energy, Environment and Water.
This study provides an in-depth assessment of greenhouse gas (GHG) emissions from the manufacturing sector (including construction) in India from 2005 to 2013. Part of The Council’s work as a member of the GHG Platform India, this report is a revised and updated version of previous estimates. It was published simultaneously with an a national-level emissions estimate report.
The study covers three key greenhouse gases, namely - carbon dioxide (CO2), methane (CH4), and nitrous oxide (N2O), which account for a large share of anthropogenic emissions from India. At the state level, 80 per cent of manufacturing emissions come from only ten states – Gujarat (14%), Odisha (13%), Chhattisgarh (10%), Jharkhand (9%), Karnataka (8%), Maharashtra (8%), Andhra Pradesh (7%), Rajasthan (5%), West-Bengal (5%), and Tamil Nadu (4%), as per 2013 estimates.
The study also provides insights on sector-wise GHG emissions estimation for all states and union territories, except Mizoram and the Lakshadweep Islands, since activity data is not available for these regions.
Emissions from top 15 states for the year 2013
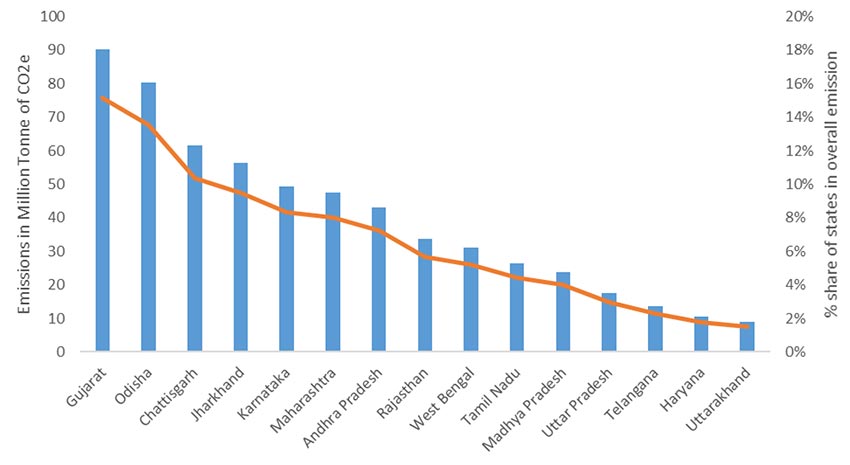
Source: CEEW analysis, 2017
State wise emissions from the manufacturing sector
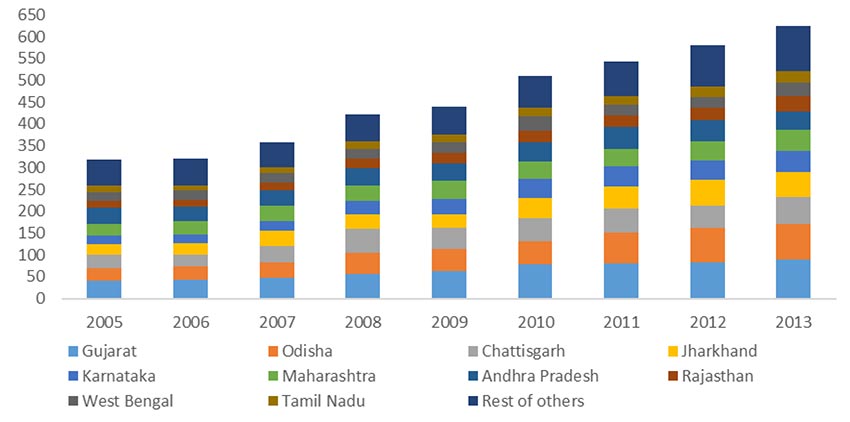
Source: CEEW analysis, 2017
CEEW is the lead partner of the GHG Platform India for the development of emissions estimates from manufacturing industries. These estimates are also compiled into an overall Trends Analysis of GHG Emissions in India, published by the GHG Platform.
This study provides an in-depth assessment of GHG emissions from the manufacturing sector (including construction) in India. Manufacturing here refers to the firms coming from the formal sector only, i.e. registered under sections 2m(i) and 2m(ii) of the Factories Act, 1948. Often, the term ‘industry’ is used interchangeably with ‘manufacturing.’ However, as per India’s national accounting procedure, manufacturing is a subset of industry, which otherwise also covers ‘mining’ and ‘electricity, gas and water supply activities.’ This reporting follows the standard guidelines issues by the Intergovernmental Panel on Climate Change (IPCC) in 2006.
The Council on Energy, Environment and Water (CEEW) has followed a bottom-up approach, making full use of secondary datasets predominantly obtained from the Ministry of Statistics and Programme Implementation (MOSPI). MOSPI provides a detailed information on the industrial energy consumption through Annual Survey of Industries (ASI). ASI reportedly covers only the formal manufacturing activity in India, as per the definitions of the Factory Act, 1948. We have resorted to alternative source of information and appropriate data assumptions, wherever felt needed. Methodology for estimation is common across all years of estimation. 2005 is investigated as a base year for the GHG estimates, whereas 2013 is the latest reporting year.
Over the past few years, Greenhouse gas emissions (GHG) from the manufacturing activities in India have increased at a rapid rate of 8% (CAGR); i.e., rising from ~315 Million Tonnes (MMT) of carbon dioxide equivalent (CO2e) in 2005, to ~623 MMT in 2013. This includes combined emissions from the energy-use, as well as industrial process and product-use (IPPU). It excludes any emissions arising from captive power generation units that are located within manufacturing facilities, as they are reported under a separate category prescribed in the IPCC guidelines (2006)1 .
This report is a revised and updated version of CEEW’s previous estimates (version 2.0) made available at the GHG Platform India. In this version, underlying methodology, data sources, emission factors, as well as choice of tiers remains same as of previous. However, as an update, choice of proxies and assumptions are now more advanced and considers state specific substance (refer methodology section of ‘energy-use emissions’). Similarly, as another major development, exclusion of captive power related emissions is ensured from the ASI database itself, unlike previous way of discounting by use of Central Electricity Authority (CEA) estimates. This makes final emission numbers slightly different for the previously accounted years
Figure 1 portrays the share of emissions of the various sub-sectors and the overall growth of emissions over the period 2005 to 2013. Besides a slight dip observed for 2009, the growth trend is almost linear and is comparable to the growth of manufacturing in India, per se.
Figure 1: Year on year growth of CO2e emissions and dominant sectors
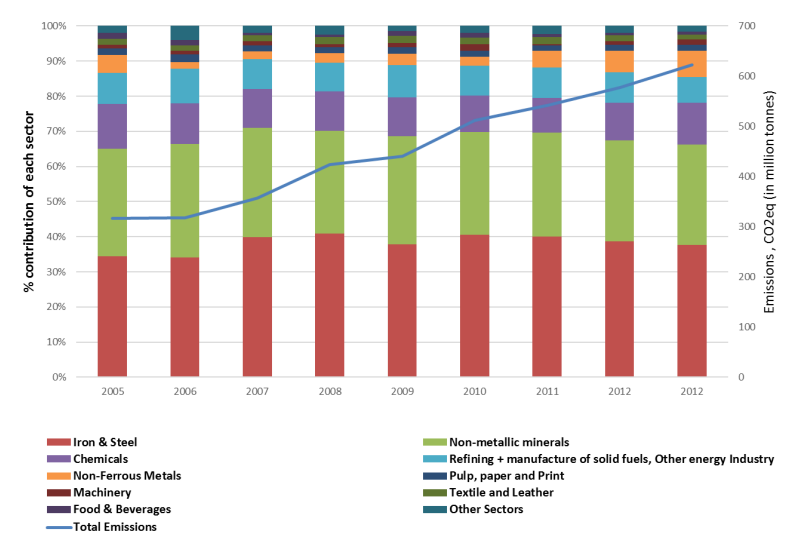
Source: CEEW analysi
Manufacturing (and processing) of iron and steel and non-metallic minerals (primarily cement) have remained the major contributors to GHG emissions. Together they represent 38% and 29% respectively for 2013, as illustrated by Figure 1. Speaking of energy use, which primarily dictates the manufacturing sector emissions, coal (use) continues to be the dominant source of energy across the sectors. Hence, its share in the energy derived emissions grew from 171 MMT of CO2e in 2005 to 385 MMT CO2e in 2013; i.e. nearly 80% of the total energy use emissions (Figure 2).
Figure 2: Energy use emission estimates from the manufacturing activities
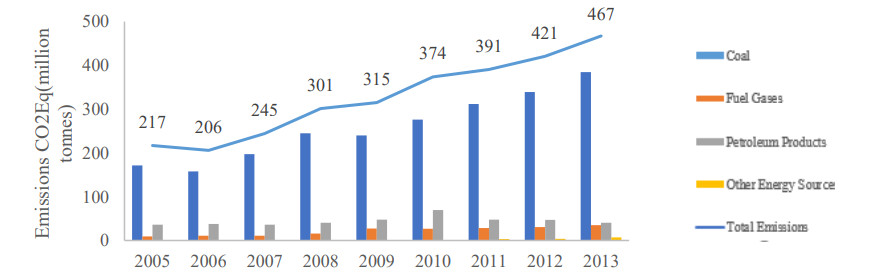
Source: CEEW analysis
Speaking of emissions at the state level, ~80% of manufacturing emissions comes from only ten states, i.e. Gujarat (14%), Odisha (13%), Chhattisgarh (10%), Jharkhand (9%), Karnataka (8%), Maharashtra (8%), Andhra Pradesh (7%), Rajasthan (5%), West-Bengal (5%), and Tamil Nadu (4%), as per 2013 estimates.
Figure 3: Emissions from top 15 states for the year 2013

Source: CEEW analysis
This study is first of its kind, in terms of providing a time series of emission estimates for India’s manufacturing sector in a transparent manner. It makes full uses of existing information with appropriate measures on correcting the data flaws, and assumptions on information gaps. However, in future, we should aspire for much better quality of information from government sources, and should make effort in apprising relevant ministries/departments for the benefit of improved datasets.
For the national level estimates, the early challenges faced by us was unavailability of segregated data on industrial energy consumption with the ministries of direct relevance; such as ministry of coal, ministry of petroleum and natural gas, ministry of power, etc. Thereafter, we explored the bottom-up information collected by the MOSPI through its ASI exercise for the want of better segregation of industrial energy consumption. The datasets were comprehensive but poor in quality. We have incorporated several corrective layers on the ASI datasets for this analysis. However, in future, we expect such quality checks to be embedded in the ASI system intrinsically. We have forwarded a set of recommendations to the MOSPI to move the needle in this direction.
How Secure is India’s Energy Future?
Unlocking the Potential for a Gas-Based Economy in India
Advancing India’s Green Steel Transition
CO₂ Pipeline Network for Carbon Capture and Storage in India
Bharat Cleantech Manufacturing Platform: Green Hydrogen Indigenisation Pathways