Home
Council on Energy, Environment and Water Integrated | International | Independent
REPORT
14 January, 2026 |

HAVE A QUERY?

HAVE A QUERY?

Sign up for the latest on our pioneering research

Report Launch
Cattle and Community in a Changing Climate: Sustainable Pathways for India's Dairy Sector

20 Jan 2026   |   09:30 - 14:00 IST

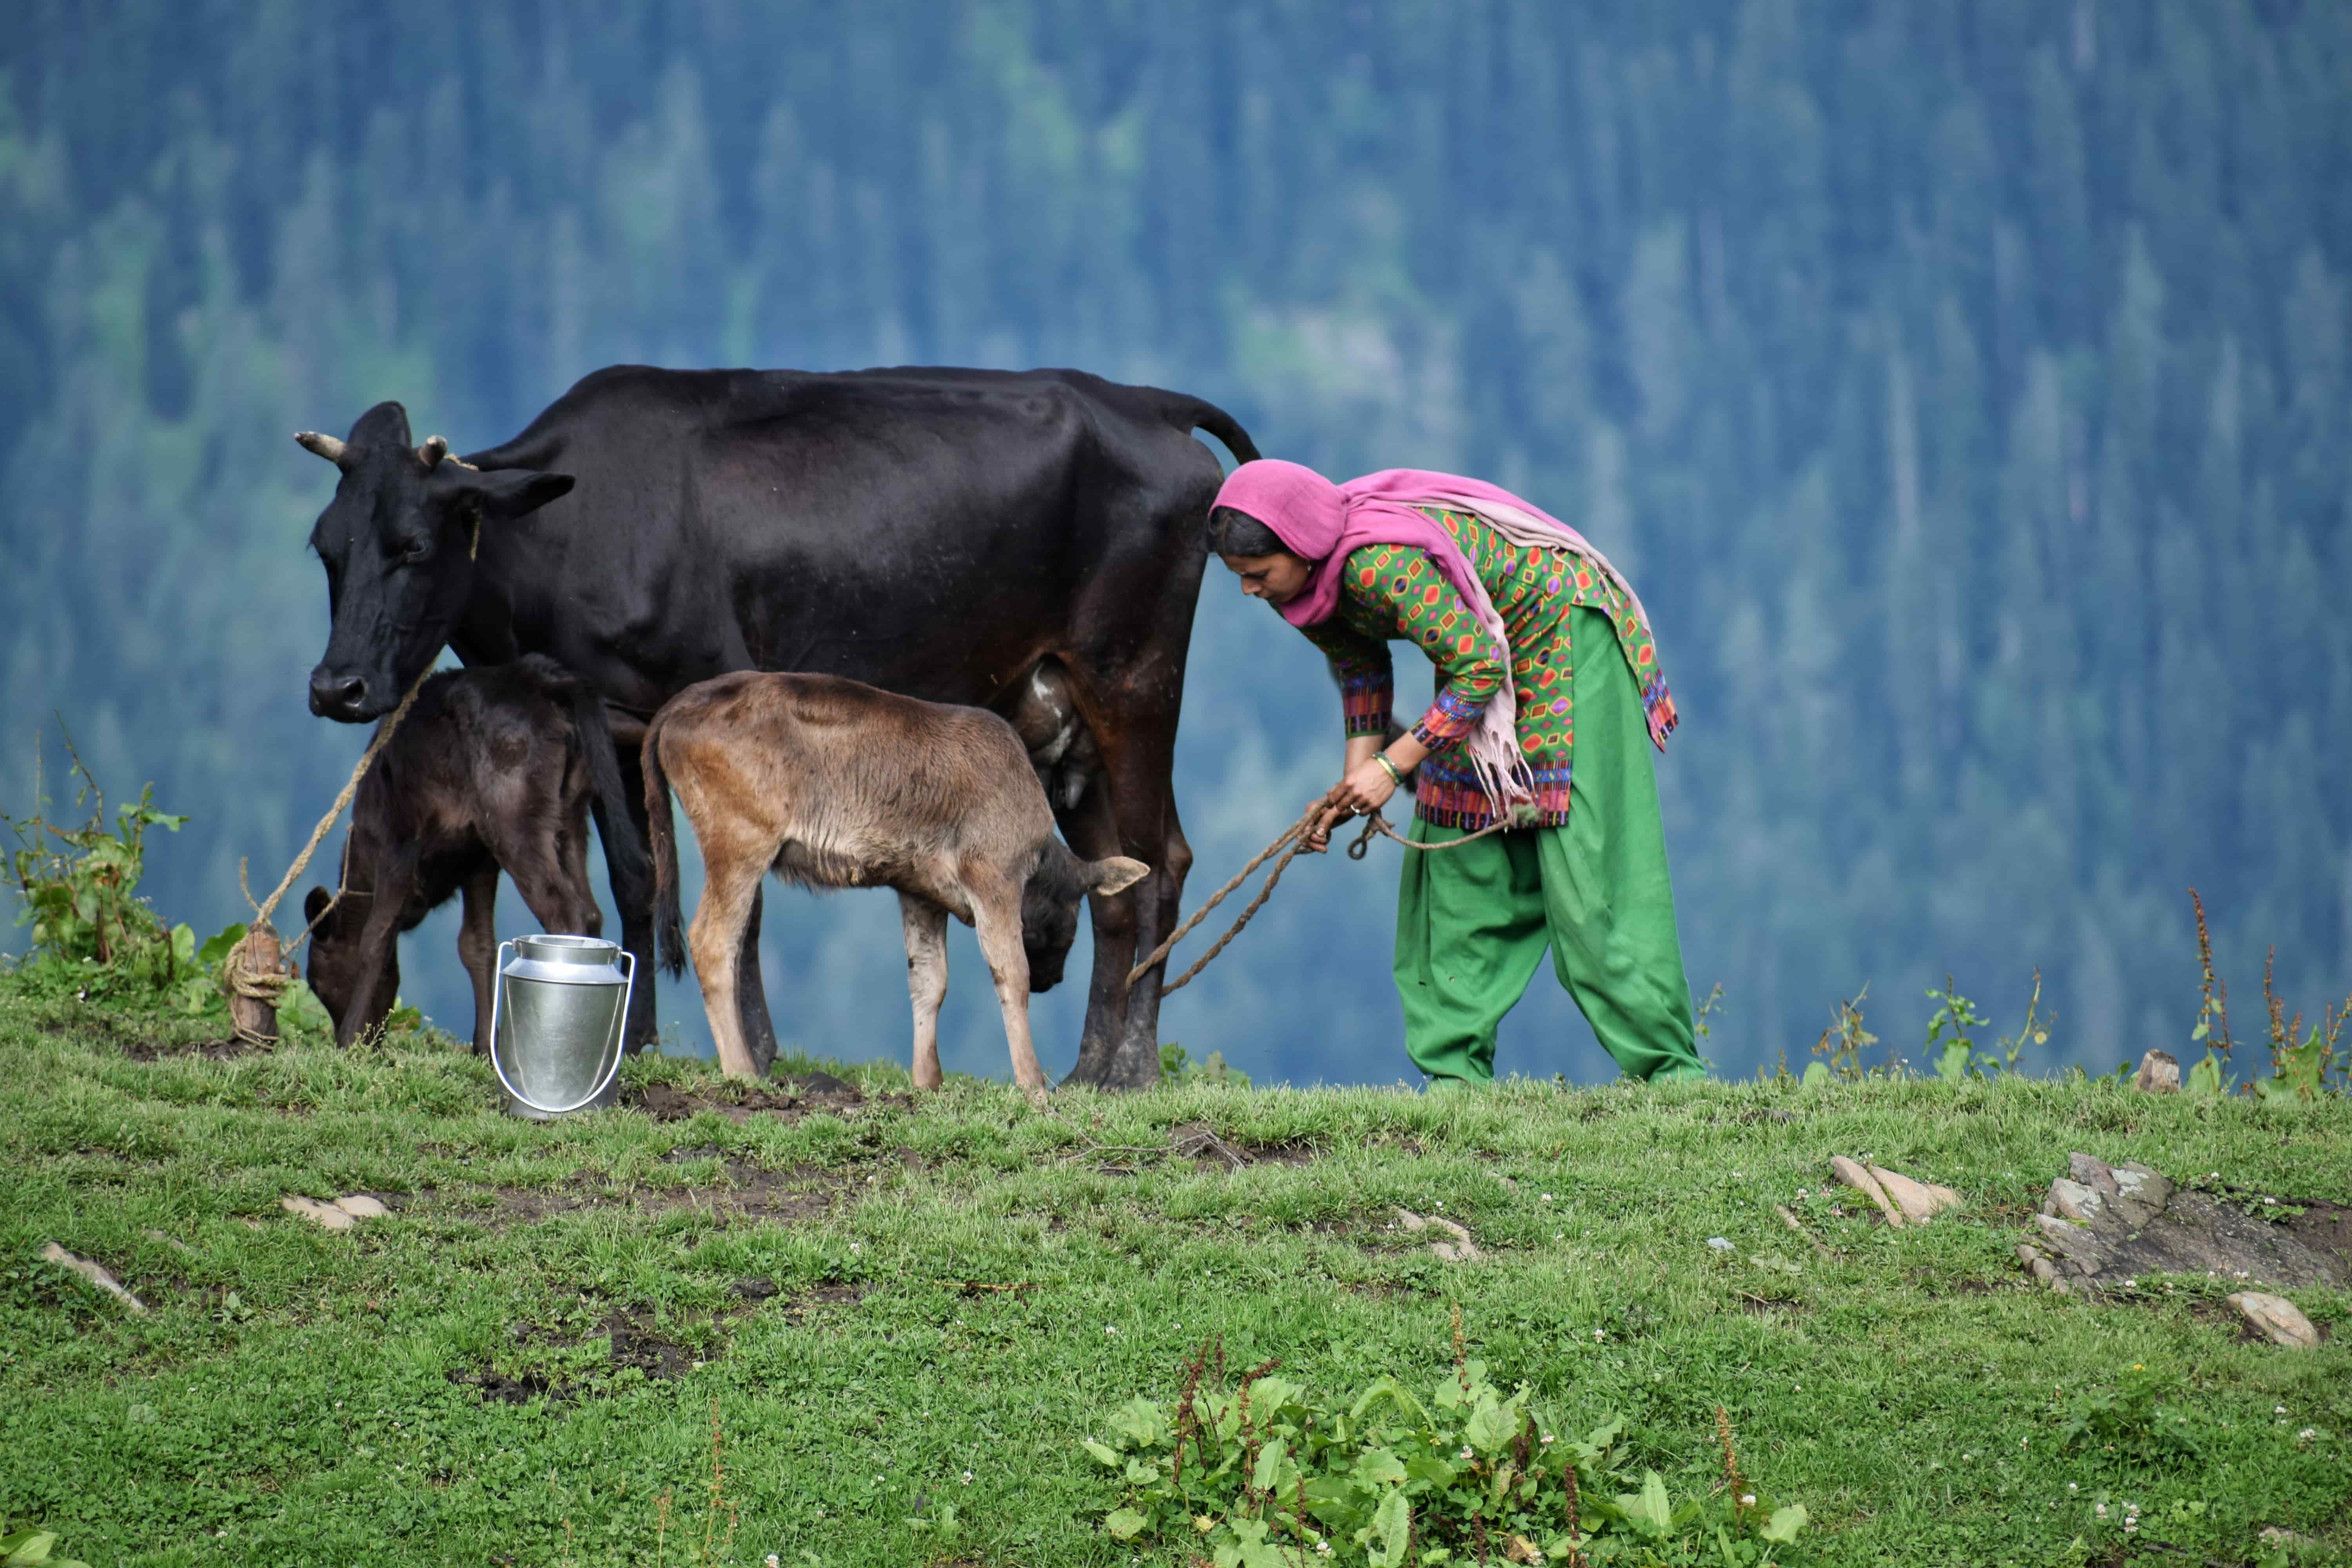
The Council on Energy, Environment and Water (CEEW) is pleased to invite you to the report launch session on ‘Cattle and Community in a Changing Climate: Sustainable Pathways for India's Dairy Sector’ on 20 January 2026, 0900–1400 IST, at the Constitution Club of India, New Delhi.

Why do rearers keep bovine animals - are these decisions driven only by income and milk production, or by a wider set of social, cultural, and risk-related considerations? What shapes the choice of animals they rear, and why do some rearers adopt new practices and interventions while others do not? How do rearers perceive and respond to the impacts of climate change on animal health and productivity, and why do certain households choose to expand their herds while others exit the sector? Together, these choices have far-reaching implications for livelihoods, environmental sustainability, nutrition and the sector overall.

To address this knowledge gap, the Council on Energy, Environment and Water (CEEW) undertook a first-of-its-kind national survey of 7,500 cattle-rearing households across 15 states. Going beyond conventional metrics on animal numbers and production, the research explores the motivations, constraints, and contextual factors that influence bovine-rearing choices and the evolving risks facing the sector. This event convenes policymakers, civil society organisations, private sector actors, and grassroots practitioners to reflect on these insights and identify evidence-based pathways towards a more resilient and inclusive dairy sector.

For Event Queries

Yadu Kathuria

Communications Consultant

[email protected]

Key Speakers

REPORT
30 August, 2025 |

HAVE A QUERY?

Frequently Asked Questions

  • What framework does the action plan propose for managing floods in Navsari city?

    The action plan adopts a three phase framework consisting of pre-monsoon (preparedness and planning), monsoon (response), and post-monsoon (recovery and rehabilitation) stages. Within this structure, specific actions are assigned to nodal departments with clear responsibilities and support from allied agencies. The plan also integrates cost estimates and identifies potential funding sources, including central schemes and public-private partnership models, to enable sustained implementation.

  • What financing mechanisms are proposed for flood risk management?

    The plan suggests leveraging ongoing government programmes such as AMRUT 2.0 and the flood management and border area programme, along with allocations under the 15th Finance Commission’s disaster risk funds. In addition, public-private partnership models such as hybrid annuity, design-build-finance-operate, and service contracts are recommended to mobilise private sector investment in flood-resilient infrastructure and early warning systems.

  • What is the key takeaway from the Navsari City Action Plan for flood risk management?

    The key takeaway is that Navsari now has a clear, evidence-based roadmap that shows which areas are most at risk, what actions need to be taken, and who should take responsibility. It turns scattered efforts into a structured approach, giving the city a practical way forward to handle floods more effectively in the years ahead.

  •  

HAVE A QUERY?

Sign up for the latest on our pioneering research

ISSUE BRIEF
27 December, 2025 |

HAVE A QUERY?

Frequently Asked Questions

  • Why do rice emissions occur?

    Rice emissions occur because flooded fields create oxygen-free soil conditions that allow microbes to produce emissions during organic matter decomposition.

  • What are sustainable alternatives to conventional flooded rice?

    Methods like DSR, SRI, AWD, drip irrigation, and short-duration cultivars reduce emissions and improve resilience.

  •  

HAVE A QUERY?

Sign up for the latest on our pioneering research

ISSUE BRIEF
16 December, 2025 |

Sign up for the latest on our pioneering research

POLICY BRIEF
10 December, 2025 |

HAVE A QUERY?

Frequently Asked Questions

  • What are the key takeaways of this study on India's dietary diversity?

    This CEEW study analyzes NSSO HCES data (2011–12; 2023–2024) to show India has shifted from a calorie crisis to a dietary quality crisis. Key findings include the skewed protein intake (nearly 50% of protein comes from low-quality cereals, far above the 32% recommendation), surging fat overconsumption (2.5x RDA), and under-consumption of pulses, coarse grains, and green leafy vegetables. The report urges policy reform to diversify public food programs and use targeted messaging to promote nutrient-rich foods across all income groups.

  • How significant is the protein quality issue found in the report?

    While India's average at-home protein intake is adequate in quantity (55.6 g per day), its quality remains poor because nearly half of it is derived from cereals, which are a low-quality protein source due to their incomplete amino acid profile, which lacks lysine. This crowds out higher-quality proteins like pulses (contributing just 11% vs. 19% recommended) and animal-based sources, leading to suboptimal nutrition despite sufficient total grams.

  • How does income inequality affect nutrient consumption?

    Nutrient intake rises significantly with income, with the top expenditure decile consuming 1.5 times more protein than the poorest. This gap is most pronounced for nutrient-dense foods: the lowest rural decile meets only 28 per cent of the RDA for milk, 31 per cent for fruits, and 38 per cent for eggs, fish, and meat, while the top decile overconsumes beyond the RDA in all three categories.

  • What specific dietary overconsumption trends were observed?

    The study highlights three major overconsumption risks: 1) Fat: At-home intake is nearly 2.5 times the RDA, driven by cooking oils. 2) Salt: Consumption is around 11 g per day, more than double the WHO limit of 5 g. 3) Sugar: Total intake is approximately double the recommended limit, largely due to indirect consumption through processed foods. This overconsumption is accelerating rapidly among higher-decile rural and urban groups.

  • What are the key recommendations?

    At the systems level, reforming major public food programmes, including the PDS, PM POSHAN, and Saksham Anganwadi & POSHAN 2.0, is essential to shift away from cereal-dominant provisioning and expand access to coarse grains, pulses, fruits, and vegetables, and enhancing protein diversity in school meals with milk or eggs. Delivering this transformation requires coordinated action across governments, markets, and civil society: aligning procurement with regional nutritious foods, embedding behaviour-change efforts in schools and community platforms, reformulating healthier food offerings in the private sector, and leveraging media and digital influencers to reshape dietary preferences. With stronger convergence and visibility, India can move beyond calorie sufficiency towards more balanced, diverse, and sustainable diets that improve long-term public health.

  •  

HAVE A QUERY?

Sign up for the latest on our pioneering research

Mansingh 3 and 4, Taj Mahal, New Delhi
How Is India Advancing its Electric Mobility Transition? An Assessment of Market Trends and Policy Performance

16 Dec 2025   |   10:00 – 14:00 IST

Session brief:

The CEEW - Green Finance Centre (GFC) is pleased to invite you to the ‘Dialogue on Advancing India’s Electric Mobility Transition: Assessing Market Trends and Policy Performance’. The dialogue will also feature (a) the launch of a report on ‘Navigating India's Electric Mobility Transition: Evaluating Market Dynamics and Analysing Policy Shifts’ and (b) the new EV Savings Tool on the CEEW-GFC EV dashboard.

As India seeks to accelerate sustainable transportation and strengthen domestic competitiveness, this dialogue aims to create a platform for evidence-based engagement on market developments, policy impact, infrastructure readiness, financing pathways, and opportunities to deepen adoption across states and sectors.

India’s electric mobility transition has entered a critical phase. Over the past few years, EV adoption has risen sharply across two-wheelers, three-wheelers, and emerging categories, supported by national and state-level policies, market innovation, and growing consumer acceptance. At the same time, challenges around policy implementation, infrastructure visibility, financing constraints, and data transparency continue to shape the pace and distribution of adoption.

Building on this momentum, India’s EV transition is entering a phase where market growth, state-level initiatives, and evolving national policies are creating new opportunities for broader and more coordinated progress. As the ecosystem matures, clearer long-term signals, improved data visibility, and more harmonised support across states will play an important role in sustaining inclusive and well-distributed adoption.

CEEW-GFC’s new report, Navigating India's Electric Mobility Transition, provides a comprehensive comparison of national EV policies and an assessment of national and subnational adoption trends.  Grounded in data and policy analysis, the report aims to inform government decision-making, guide industry strategy, and support the development of a robust, inclusive, and future-ready EV ecosystem.
 

For Event Queries

Yadu Kathuria

Communications Consultant

[email protected]

Key Speakers

REPORT
02 December, 2025 |

HAVE A QUERY?

Frequently Asked Questions

  • Which specific construction activities were identified as pollutant-intensive?

    The pilot study categorised construction activities based on their potential to generate dust emissions. Excavation, earthwork, roadwork, and vehicle movement were found to be pollutant-intensive activities. Vehicular movement was identified as the most polluting activity (typically generating PM2.5 levels about 2.5 times higher than no-work levels) if the internal site roads are unpaved. During activities like excavation, earthwork, roadwork, and vehicle movement, the PM2.5 concentration increased by around 1.8 times compared to non-pollutant-intensive activities. Activities such as foundation and framework, brickwork, and cement and concrete work were considered non-pollutant-intensive or less polluting, generating median PM2.5 concentrations of less than ~40 μg/m³, which is similar to the median concentration recorded on no-work days.

  • How effective are mitigation measures at reducing particulate matter (PM) levels on a construction site, and for how long does the impact last?

    Dust mitigation measures such as water sprinkling were found to be significantly effective at reducing PM2.5 levels at the construction site. If water sprinkling is deployed near an active area for approximately 30–40 minutes, PM levels can be reduced by 45–70 per cent. The positive impact of this intervention lasts for nearly 3 to 4 hours. Implementing water sprinkling at regular intervals of 3 to 4 hours, or approximately three times a day, is recommended to effectively reduce PM levels and minimise exposure risks.

  • Why does the report recommend moving away from "blanket bans" on construction activities during high-pollution episodes?

    The report argues that current measures, such as blanket construction bans enforced under the Graded Response Action Plan (GRAP), are often applied without sufficient ground-level data to distinguish which activities are the most polluting. These restrictions often disproportionately affect daily-wage workers, contractors, and builders. For instance, construction activities in Delhi-NCR were halted for a cumulative total of 78 days under GRAP in 2023 and 2024, leading to delays, increased project costs, and loss of income for workers. The study advocates for a targeted, activity-specific framework that restricts only pollution-intensive tasks while permitting less polluting ones with safeguards. This approach is seen as crucial for balancing environmental concerns with economic continuity.

  • How much higher are PM2.5 concentrations during pollutant-intensive activities compared to times when no work is occurring on the site?

    The average PM2.5 concentration levels recorded during pollutant-intensive activities were significantly higher compared to the background, or "no-work," concentrations. The median PM2.5 concentrations for vehicle movement (98 μg/m³) was around 2.5 times higher than the no-work median concentration (40 μg/m³). When comparing the average concentrations of activities to the average no-work conditions (63.4±2.12 μg/m³), the pollutant-intensive activities showed substantial increases: vehicle movement caused a ~122 per cent spurt, road work showed a ~78 per cent spurt, earthwork showed a ~44 per cent spurt, and excavation showed a ~35 per cent spurt.

  •  

HAVE A QUERY?

Sign up for the latest on our pioneering research

REPORT
26 November, 2025 | ,

HAVE A QUERY?

author image
Fellow and Director - Green Economy and Impact Innovations

Frequently Asked Questions

  • What is India's green economy paradigm?

    A green economy is an economic paradigm that ‘protects the environment and stays within the ecological boundaries of nature while promoting jobs and economic prosperity’ (Jain, Jhunjhunwala et al. 2025). Any economic activity qualifies as “green” if it improves resource efficiency or conservation, or if it reduces greenhouse gas emissions and local pollution compared to conventional practices. India’s green economy paradigm, however, goes beyond this definition. It outlines how the country must strategically reshape its economy to achieve long-term, sustainable prosperity. Specifically, the paradigm emphasises: (i) mainstreaming sectors and value chains in the economy that further jobs and economic growth while regenerating/safeguarding the natural capital; (ii) enhancing economic resilience by investing in sectors that would be relevant and thriving in a low-carbon and climate-changed world; (iii) expanding the ‘greening’ of the economy to include sustainability-oriented sectors, such as bio-economy, and nature-based solutions, the circular economy in addition to the energy transition; (iv) building the capacity and skills of the (future) workforce to actively transform the economy from extractive to a regenerative one.

  • What are the three key green economic sectors, and how were they identified for India?

    The three green sectors identified are Green Energy Transition (ET), Circular Economy (CE), and Bioeconomy & Nature-based Solutions (BE and NbS). We looked at sectors in the economy that: (i) would further jobs and economic growth while regenerating/safeguarding the natural capital; (ii) would be relevant and thriving in a low-carbon and climate-changed world; (iii) would enable expanding the ‘greening’ of the economy to include sustainability-oriented sectors in addition to the energy transition. We identified the three aforementioned sectors based on the following parameters: (i) growing private sector interest and investment momentum; (ii) evolving policy support as documented in Ministry announcements and policy documents; (iii) the need to explore green opportunities in addition to the renewable energy transition (widening green opportunities across the economic spectrum, from large industries to microenterprises, and from primary sectors to tertiary ones).

  • What do the Energy Transition (ET), Circular Economy (CE), and Bio-economy & Nature-based Solutions’ (BE & NbS) sectors entail? What value chains do they cover?

    ET involves adopting essential renewable energy (RE) technologies that enable a shift towards a decarbonised economy. For our assessment, we identified 16 value chains within ET- across deployment, component manufacturing, industrial decarbonisation and decentralised renewables. For deployment, we included RE technologies such as utility-scale solar, on-shore and off-shore wind, biomass, agri PV, as well as storage technology such as pumped storage hydropower and battery energy storage systems (BESS). For component manufacturing, we identified solar modules, wind components, and batteries. Industrial decarbonisation, ranging from GH2 deployment to the production of two-, three-, and four-wheelers, eBuses, and electric medium and heavy-duty commercial vehicles such as trucks (MHDTs), as well as decentralised renewable energy (DRE)-powered livelihood applications fall within the purview of ET. The sector is pivotal to decarbonising the economy while advancing energy access, advancing local enterprise, employment, and overall economic growth. The CE is a system designed to maximise resource efficiency by minimising waste, promoting maintenance, reuse, refurbishment, remanufacturing, recycling, and reducing environmental impacts associated with resource extraction and disposal. We have identified seven value chains within CE: resource recovery from the organic fraction of municipal solid waste, plastic waste recycling, electrical and electronic equipment waste (e-waste) recycling, lithium-ion battery (LIB) waste recycling, end-of-life vehicle (ELV) scrapping, used cooking oil (UCO) recycling, and used water treatment and reuse. BE is described as an efficient method of transforming and utilising biological resources to generate economic goods, thus fostering revenue growth towards realising a sustainable economy. BE encompasses a broad range of value chains, including biofibers, bio-inputs, bio-residue based packaging, second-generation biofuels, nutraceuticals, and compound cattle feed. While the BE focuses on product-based industries, NbS involves actions like protecting, restoring, or sustainably managing natural ecosystems to create income and job opportunities for local communities (Jain, Jhunjhunwala et al. 2025). It encompasses value chains such as wetland management, seaweed cultivation, sustainable forest management, sustainable tourism, and chemical-free agriculture. Within the combined sector, we have identified 13 value chains which could actualise India’s green transition.

  • What have we examined for each of the thirty-six green value chains?

    We estimate the job, market, and investment (J-M-I) potential for each of the green value chains by 2047. For jobs, only full-time equivalent (FTE) jobs are calculated, Additionally, for each value chain, we identify challenges to implementation and corresponding recommendations, risks associated with scaling, and a story from the ground to inspire action.

  • What recommendations have been proposed to implement a green economy in India?

    We recommend a comprehensive set of measures to operationalise a green economy in India. These include: improving the economic viability of green solutions through public procurement, blending mandates, tax incentives, and viability gap funding; strengthening raw material supply chains by reducing import dependence, formalising the circular economy workforce, and investing in bio-processing technologies; and significantly boosting domestic R&D and innovation through dedicated funds, private-sector incentives, and regulatory sandboxes for climate technologies. We also call for building a future-ready workforce through industry–academia partnerships, expanded green job certifications, and support for local women-led enterprises in nature-based solutions. Finally, we emphasise the need for stronger standardisation and certification frameworks to improve quality, reduce market fragmentation, and build consumer trust—anchored in a coordinated whole-of-nation (one that integrates green value chains into local, district, state, and national economic planning), whole-of-government (one that aligns ministries, schemes, and regulatory frameworks to accelerate adoption and investment), and whole-of-economy (one that empowers MSMEs, cooperatives, startups, and large industry to participate and benefit, while expanding opportunities for women and youth) approach to scale green value chains across India.

  •  

HAVE A QUERY?

author image
Fellow and Director - Green Economy and Impact Innovations

Sign up for the latest on our pioneering research

REPORT
28 November, 2025 |

HAVE A QUERY?

Frequently Asked Questions

  • Why do we need to integrate Climate change adaptation principles with Integrated water resource management for agriculture ?

    Traditionally, IWRM ignores climate change uncertainties, relying on a ‘long-term approach’ based on ‘stationarity’, assuming natural systems are stable and past water and climate patterns predict the future. This assumption no longer holds due to climate change, which introduces large uncertainties in projections. This is where integrating the principle IWRM in the goal of CCA gives a structured approach for evaluating how effectively national and subnational policies is performing.

  • What are the key goals in the IWRM and CCA framework?

    The IWRM and CCA framework has five key goals: adopting an integrated approach through multi-sectoral, multi-level governance; incorporating climate change considerations by assessing risks and implementing adaptation; ensuring environmental sustainability by protecting water resources and ecosystems; promoting economic efficiency by optimising scarce water and financial resources; and advancing social equity by guaranteeing equal water access for all, especially marginalised and vulnerable groups.

  • Which countries were selected for national case studies and why?

    To select national case studies, we used SDG 6.5.1 reporting data, which tracks IWRM implementation globally. From 183 countries, we shortlisted 47 high performers. We then chose those with significant agricultural land: Australia, India, China, France, and Saudi Arabia, and added Spain and the Netherlands for their exemplary water management practices and policies.

  • How can gender perspectives be included in water resource management?

    One way the study finds is that gender perspectives can be included in water resource management by adopting gender-responsive strategies that address disparities and ensure women’s participation in agriculture and water governance. Examples include Bihar and Odisha’s SAPCC frameworks. This requires capacity building on gender issues, incorporating legal and socio-cultural dimensions, and developing sex-disaggregated databases for effective monitoring, assessment, and long-term equality.

  • What are some key considerations identified in the subnational policy instruments for climate change in Bihar and Odisha?

    Adaptation is the central focus of Bihar and Odisha’s policies, while mitigation is considered only as a co-benefit. The SAPCCs, Odisha’s Agriculture Policy (2020), and Bihar’s Agriculture Roadmap (2023) prioritise building adaptive capacity in vulnerable sectors like water and agriculture. Odisha’s SAPCC, for instance, proposes expanding hydrometry networks, improving water-use efficiency, conducting audits, and better pricing. Mitigation benefits emerge indirectly through these adaptation-led strategies.

  •  

HAVE A QUERY?

Sign up for the latest on our pioneering research

Pages