Council on Energy, Environment and Water Integrated | International | Independent
Afforestation is often thought of as the go-to method of carbon sequestration — the process of capturing and storing carbon dioxide (CO2). But to combat climate change and go net-zero on carbon emissions, India will need sequestration methods that go beyond just tree planting.
To illustrate, think of afforestation as the foundation of a sustainable future, much like the cornerstone of a sturdy building. However, just as a building requires more than a strong foundation to stand tall, India's carbon sequestration efforts need additional measures beyond afforestation to combat climate change and reach environmental targets effectively.
India aims to enhance its carbon sequestration efforts by increasing forest and tree cover to 33 per cent right from the time the National Forest Policy, 1988, was released and, under the Paris Agreement, pledged to create an additional carbon sink of 2.5 to 3 billion tonnes by 2030. India also pledged to restore its degraded forests to boost carbon sequestration by 2030 under the Bonn Challenge. It already promotes agroforestry methods like agro-silviculture and agro-silvopastoral systems for sustainable carbon capture.
While afforestation stands as a crucial pillar, it grapples with a few challenges. For instance, careful species selection of trees is crucial because wrong choices lead to poor growth and increase their susceptibility to pests. Maturity age is another factor, as trees take years to reach their carbon capture potential. Agricultural conflicts can also arise when afforestation competes with the land available for food production. Moreover, forest fires in recent years have also challenged successful afforestation efforts. Relying solely on this method, therefore, is not enough. India should explore emerging alternative carbon sequestration methods such as protecting grass and shrubland, promoting blue carbon, utilising algae-bacteria sequestration, and improving agricultural management.
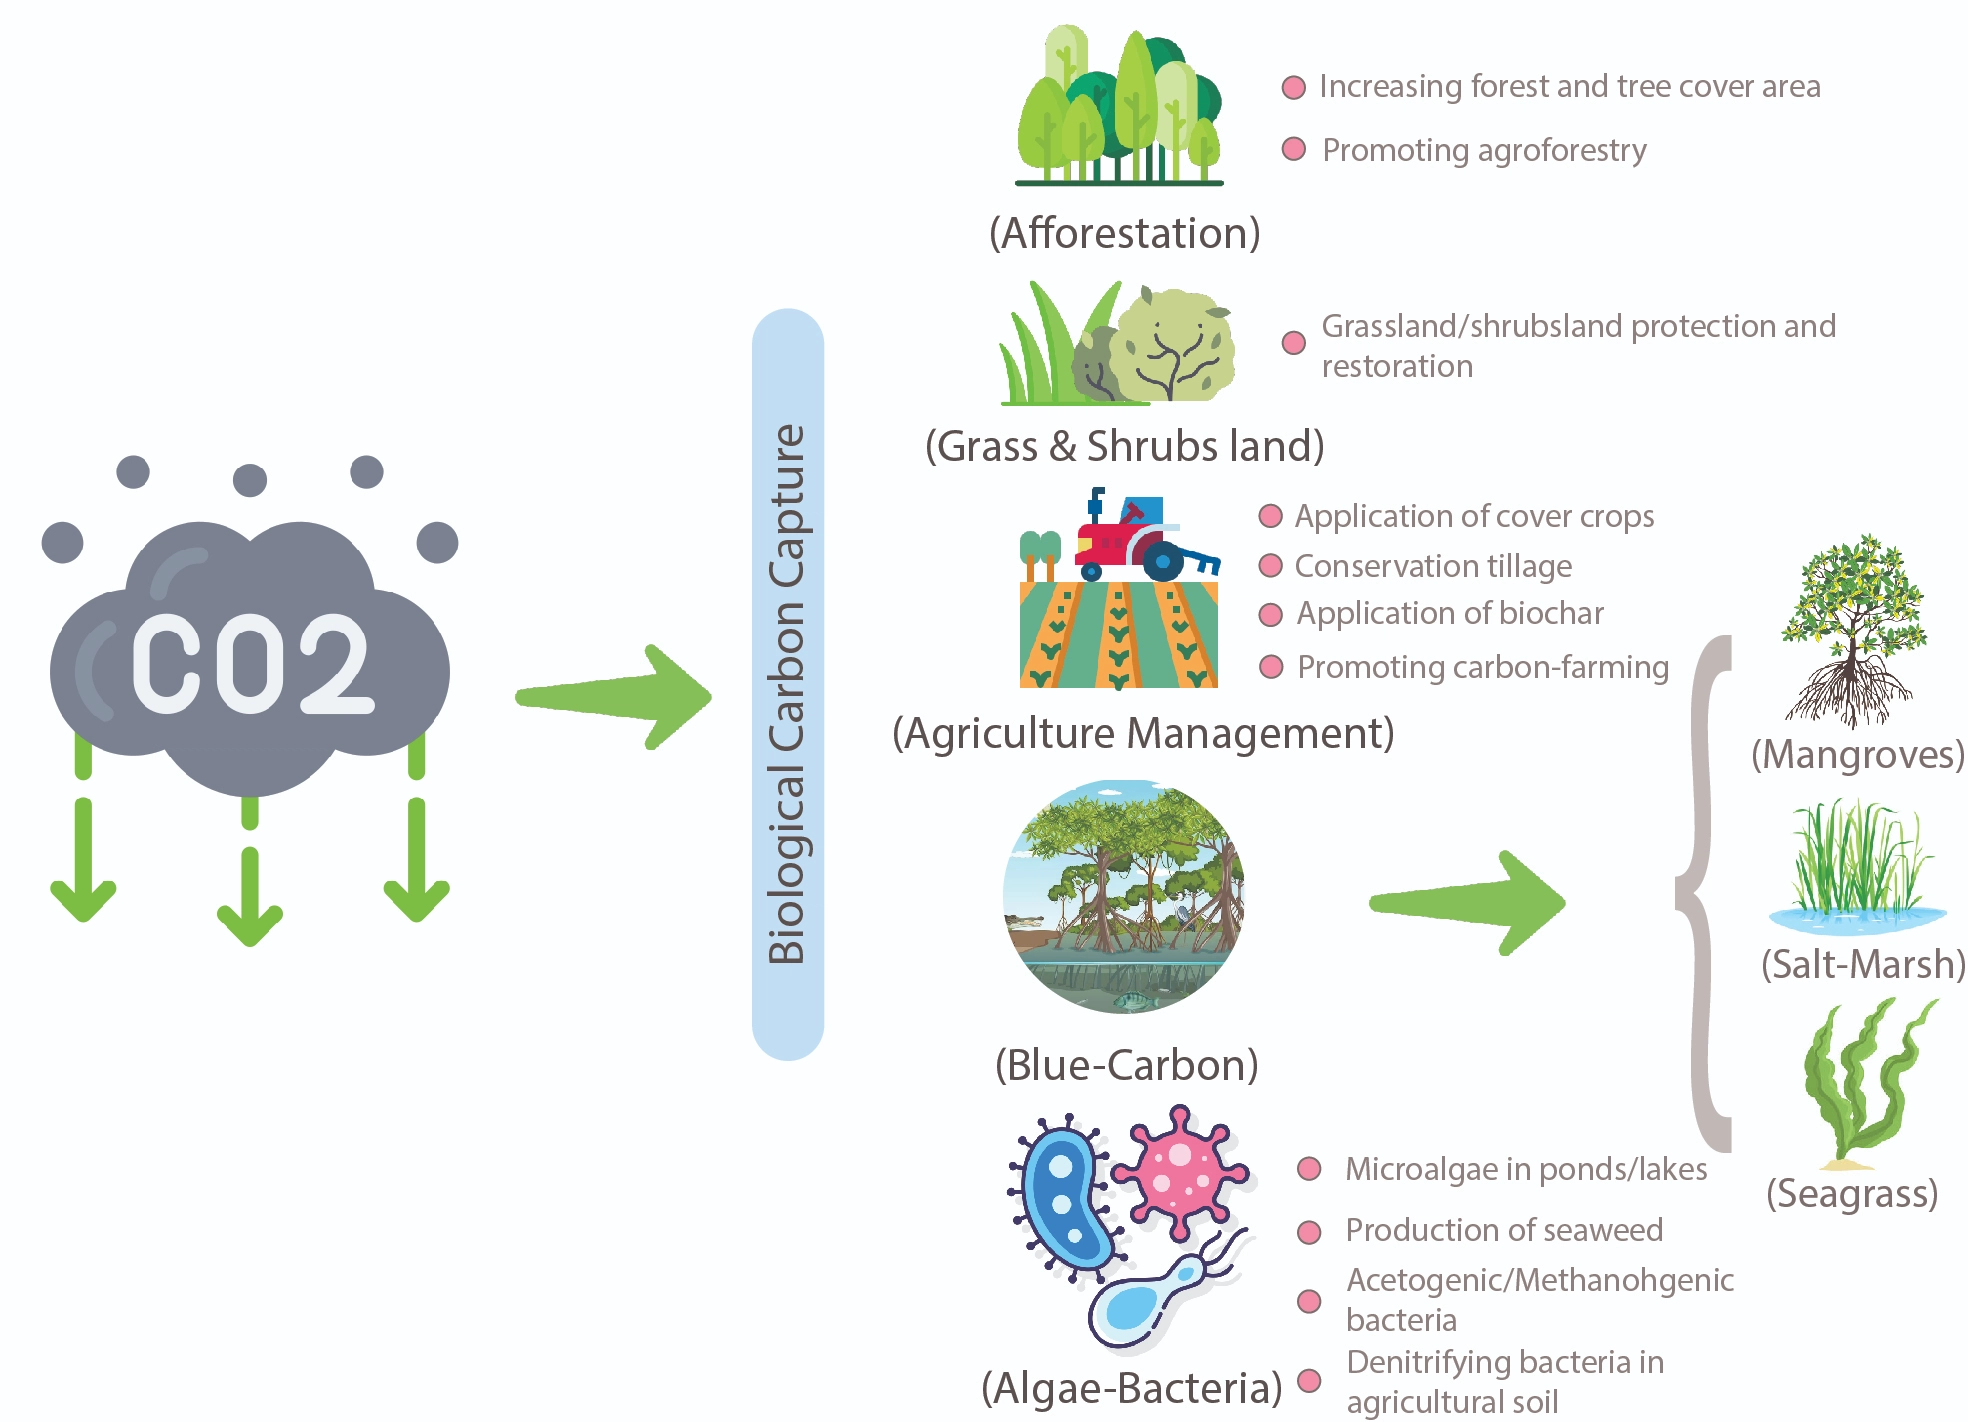
The description of different biological carbon capture methods (Source: Authors’ illustrations and vectors are taken from https://www.flaticon.com/).
Blue carbon sinks, like mangroves, salt marshes, and seagrasses, are effective tools for climate change mitigation, sequestering 2.67 times more carbon than afforestation and over 10 times more than grasslands and agriculture. Besides, seaweeds (macroalgae) not only directly capture carbon from the atmosphere but can also serve as animal feed for livestock, potentially reducing methane emissions from their digestion and indirectly lowering greenhouse gas emissions.
India's mangrove forests covering 4,992 km2, which represents 66 per cent of the country's coastline, are also remarkable carbon sinks, currently storing 702.42 million tonnes of CO2e and having the potential to sequester 748.17 million tons of CO2e by 2030. Furthermore, climate-smart agricultural practices (such as conservation tillage, cover crops, and biochar applications) have proved to be effective strategies for increasing soil organic carbon sequestration and decreasing greenhouse gas emissions. While India took active steps to globally promote blue carbon sequestration through its G20 presidency by proposing initiatives such as creating a comprehensive international framework for blue carbon sequestration and establishing a Blue Carbon Research and Development Centre, it is crucial to acknowledge and address the inherent challenges to effectively implement these alternative carbon sequestration methods at a nationwide scale.
Here's how India can effectively amplify alternative carbon sequestration methods beyond afforestation.
Research funding, technology incubation, and public-private synergy: India should adopt a comprehensive policy approach that considers the well-being of local communities and recognises the social and economic value of these ecosystems, drawing inspiration from successful international initiatives such as Australia's mangrove conservation in the Great Barrier Reef and projects in Africa, such as Zimbabwe's conservation agriculture and Morocco's climate-smart agriculture initiatives. To diversify its carbon capture methods, India should allocate research funding beyond afforestation and focus on innovative technologies such as soil carbon enhancement, blue carbon, and algae-bacteria-related carbon sequestration. Establishing specialised technology centres and promoting public-private partnerships with incentives such as tax breaks and subsidies can attract private-sector investments.
Additionally, India needs to develop detailed technology roadmaps for various carbon capture methods and robust regulatory frameworks to facilitate the adoption of emerging technologies, ensuring they align with global sustainability goals and contribute significantly to environmental and economic well-being.
Long-term monitoring and evaluation: India needs to implement a robust monitoring and evaluation system to track the effectiveness and impact of different carbon capture technologies, regularly assess their contribution to carbon reduction goals and make necessary adjustments. A noteworthy example would be the monitoring and restoration of the mangroves of Sundarbans. The project was initially under the Afforestation, Reforestation, and Restoration (ARR) category, but after the recognition of the importance of the mangroves’ blue carbon sequestration capacity, the project was gradually converted into a successful community-managed voluntary monitoring system funded by the emission reduction credits issued by UNFCC).
Carbon markets and incentives: Establish a carbon market that incentivises local stakeholders to invest in carbon capture and storage methods. It must implement carbon pricing mechanisms that reward organisations for adopting and scaling innovative technologies. A notable example of this approach is the World Bank BioCarbon Fund (WBBCF), which purchased sequestered carbon at a rate of 4 USD per tonne of CO2e, where participating farmers received USD 3.29 per hectare per year, in addition to free training sessions and workshops.
Capacity building, workforce training, and international collaboration: In 2011, western Indian Ocean nations like Tanzania and Mauritius boosted seaweed production through capacity building, training, and international collaboration. This effort increased annual production from 11,000 to 15,088 tonnes by 2012. India should prioritise investing in training programmes for skilled carbon capture system experts, including farmers in advanced seaweed cultivation techniques. This not only enhances production and the local economy but also involves more farmers. Additionally, researching seaweed for livestock feed emission reduction is crucial. India has collaborated with Norway for ocean management, but further partnerships with international organisations and research institutes are vital for sharing carbon capture best practices.
While afforestation remains a cornerstone of carbon sequestration efforts, diversifying our approach is essential for addressing the multifaceted challenges posed by climate change. India's commitment to sustainability and innovation can drive the exploration and implementation of these diverse methods, ultimately leading to a more resilient and greener future.
Joy Rajbanshi is a Programme Associate at the Council on Energy, Environment and Water (CEEW). Send your comments to [email protected].
CEEW's Faces of Climate Resilience, a 16-part short documentary series in partnership with India Climate Collaborative, Edelgive Foundation and Drokpa Films, won the prestigious 2023 CMCC Climate Change Communication Award "Rebecca Ballestra" in Florence, Italy. The project stood out among 372 entries (and 25 finalists) from over 50 countries. The CMCC Foundation, established in 2005 with the support of the Italian Ministries of Education and Environment, sponsors the award.
The projects considered for the award were a mix of immersive experiences, art installations, audio-visual stories, information design projects, gamification and campaigns. The shortlisted projects included entries from international institutions, scholars and artists like the World Bank, EU Climate Action, Climate Central, architecture firm Stefano Boeri Architetti and artist Thijs Biersteker. A jury comprising American Book Award-winning Author and Founder of the Climate Narrative Project Jeff Biggers, water artist Giuseppe La Spada, Artist and Professor at UMass Amherst Carolina Aragón, Visual Anthropologist at the University of British Columbia Fiona McDonald and Head of the Communication and Media Office at CMCC Mauro Buonocore selected the winner.
Since its launch in August 2022, Faces of Climate Resilience has won awards at the Docs Without Border International Festival (USA) and the Aravali International Film Festival (India). It's also an official selection at Kalamata International Short Documentary Festival (Greece) 2023, Goethe-Institut's Science Film Festival (Bangladesh, India, Pakistan, Sri Lanka) 2023, Urban Climate Film Festival (India) 2023, MediaOne Academy Film Festival 2023 (India) and Ankur Film Festival (India) 2022.
Watch the films here.
Sachin Zachariah, Bhawna Tyagi and Neeraj Kuldeep
November 2023 |
Suggested citation: Zachariah, Sachin, Bhawna Tyagi, and Neeraj Kuldeep. 2023. Mapping India’s residential rooftop solar potential A bottom up assessment using primary data. New Delhi: Council on Energy, Environment and Water.
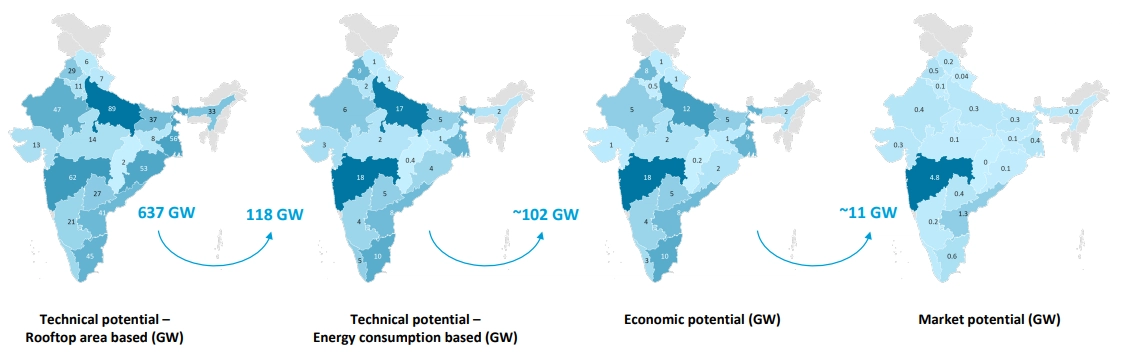
CEEW conducted a detailed assessment of the technical, economic, and market potential of deploying rooftop solar (RTS) in Indian households by adopting the bottom-up approach. i.e. starting at the household level. The study utilises the primary data collected in India Residential Energy Survey (IRES) of 14,850 households spanning across 21 states and 152 districts in 2020. The assessment further provides insights into the RTS potential of different states, the urban-rural split, and the potential for different system sizes.
Rooftop solar provides an opportunity for households to contribute significantly to the ongoing energy transition by substituting their electricity consumption with solar. The true economic and market potential can be captured only by considering households’ economic strength and energy footprint.
National-level estimations:
Source: Authors' analysis
State-level estimations:
According to Bridge to India’s Solar Rooftop Map (June 2023), the residential rooftop solar installed capacity in India is 2.7 GW.
India has set a target of 40 GW of rooftop solar by 2022, out of which ~11 GW has been achieved as of 31.10.2023.
Rooftop solar can help consumers save on their electricity bill with the use of available roof space. It also provides residential consumers access to reliable and clean electricity and an opportunity to contribute significantly to India’s energy transition. Rooftop solar also reduces T&D losses as the points of electricity generation and consumption are colocated.
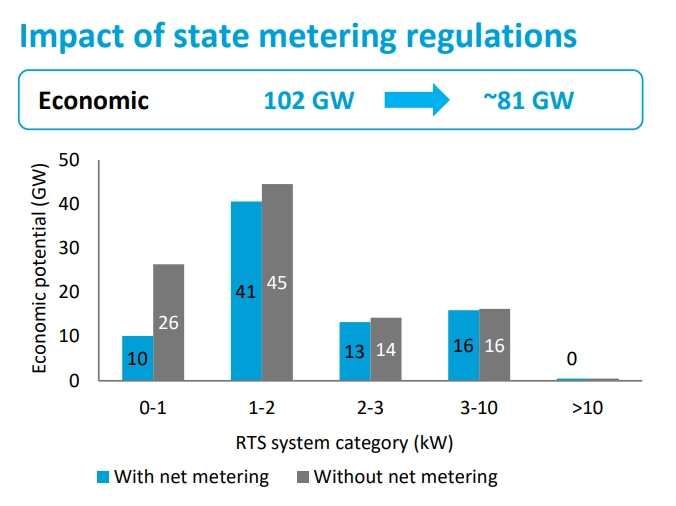
What is the payback period for rooftop solar in India? The MNRE-notified benchmark cost of a rooftop solar system of size 1 - 2 kW is INR 43,140 per kW (excluding GST), applicable for general category states/ UTs. The payback period for rooftop solar in India will vary based on the system size, electricity generation and consumption, subsidy availed and so on. The study considers a payback period of less than 5 years to estimate the market potential.
MNRE has a grid-connected rooftop solar program. The program currently in its second phase which has been extended till 31.03.2026.

How does a clean-tech startup that helps farmers dry tomatoes, mangoes and pineapples take that very technology to every corner of India? Raheja Solar, a clean-tech startup, has been enhancing farmers’ income through their solar dryers, which helps reduce post-harvest losses. However, expanding the startup’s reach to farmers pan-India, especially at the last mile, has been challenging. Limited human and capital resources create barriers for India’s emerging clean-tech startups and prevent them from leveraging a sizeable market at the grassroots. Not just Raheja Solar, startups with novel solutions, especially in the clean energy sector, find it difficult to scale up in rural geographies for similar reasons. This limits their on-ground deployments to hundreds at best.
While the reach has been limited, clean energy technologies for productive use can impact 37 million livelihoods in India and have a market worth ~USD 50 billion. As per an analysis by the Council on Energy, Environment and Water (CEEW), 71 per cent of users mentioned technologies such as solar micro pumps, solar-powered vertical fodder grow units, and solar silk reeling machines had increased their annual income by 35 per cent. These technologies also impact women positively by giving them local micro-entrepreneurship opportunities. For instance, 92 per cent of the women users believed that their business knowledge and skills have become more relevant after they began using the technologies.
To help the enterprises overcome the commercial valley of death and drive impact at scale, Powering Livelihoods (a CEEW-Villgro initiative) piloted a partnership model with rural distributors of clean tech. These distributors help enterprises reach prospective customers, create awareness and accelerate the deployment of technologies. Here are some key learnings on successfully unlocking these partnerships, which can be a useful reference for emerging startups and incubators, especially in India’s rural markets.
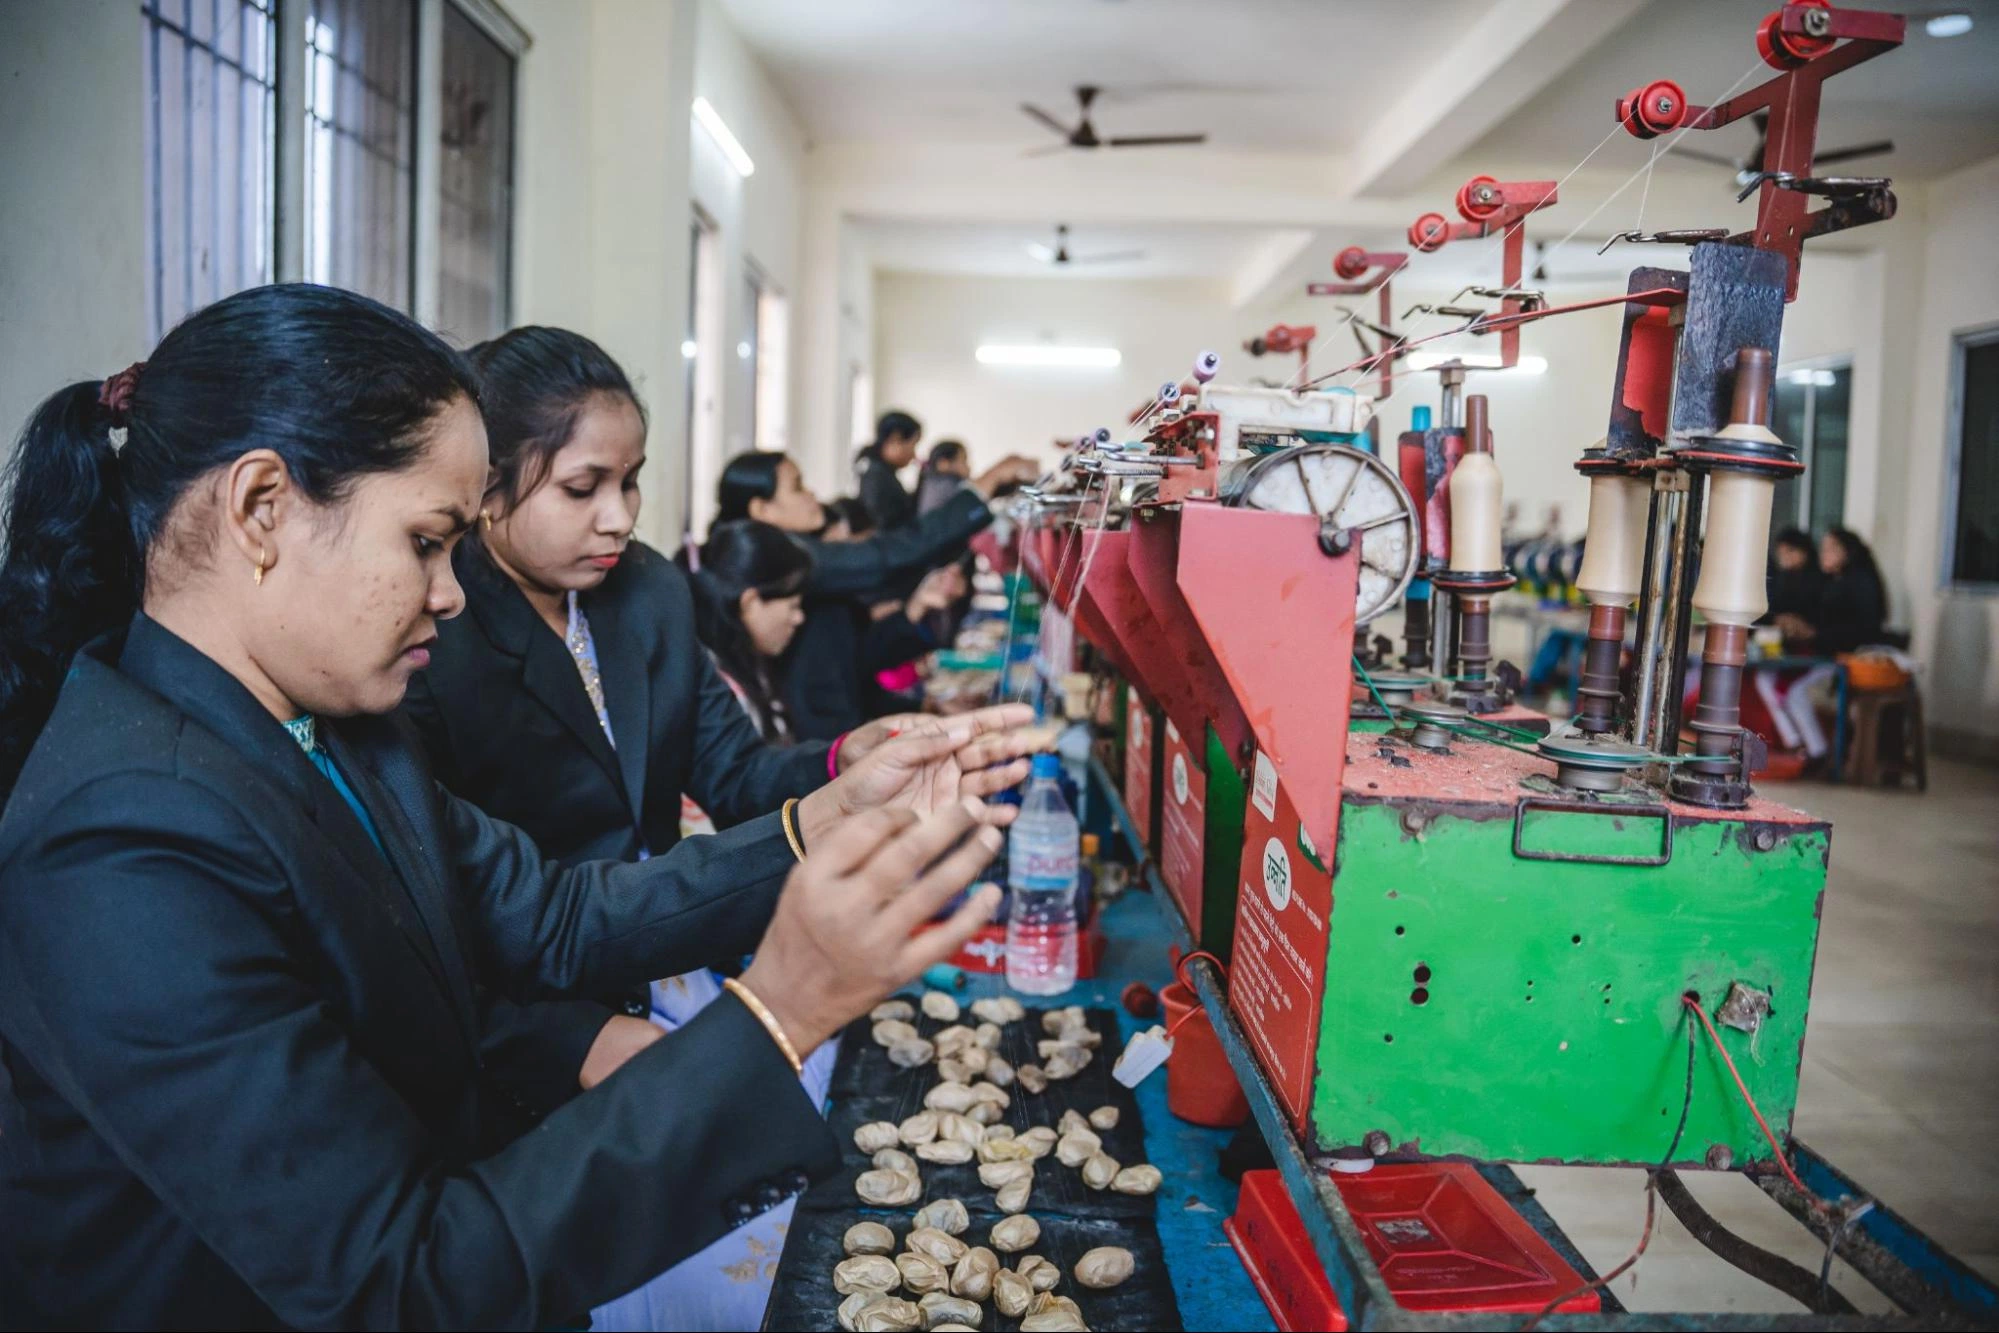
Solar silk spinning and reeling machines have a market of $25.9 million million in India, which can impact ~81,500 livelihoods
First, collaborate for efficiency. Effective collaboration happens by onboarding the right partner aligned with your vision and goal. Customer needs assessments and a collectively designed implementation plan help achieve goals in a coherent and planned manner, which leads to greater efficiency. For example, define the criteria to select your ground partners – geographical presence, prior experience in selling clean tech products, and their sales generation model. Rural startups should have a clear understanding of their target customers before strategy execution. Raheja Solar started by targeting individual farmers to sell solar dryers across India. However, closer interactions with the farmers showed that it would be more effective to approach farmer producers organisations (FPOs) instead for a commercially viable dried-products business. Now with ESSMART, a rural retailer, Raheja Solar is exploring opportunities to tie up with women’s self-help groups (SHGs) and FPOs.
Second, equip partners to enhance their effectiveness and build trust. Clean tech being a niche market requires building on-ground partners’ capacity around product specifications, economic potential and pricing. For example, enhancing their knowledge of the cost-effectiveness of solar-powered versus conventional technologies that run on grid power improves the sales pitch to rural customers. Another crucial aspect is having a well-structured Memorandum of Understanding (MoU) with a defined scope of work and roles and responsibilities for each partner.
Further, building customer awareness and understanding is also essential as these solutions are novel. Hyperlocal marketing events and product demonstrations help generate user awareness. The 25+ hyperlocal events conducted across India by Powering Livelihoods’ distributor partners generated awareness among 3,000+ rural participants with 500+ prospective leads. These were live demonstrations of technologies such as solar dryers, silk-reeling machines, hydroponic fodder-growing units, and micro food-processing units.
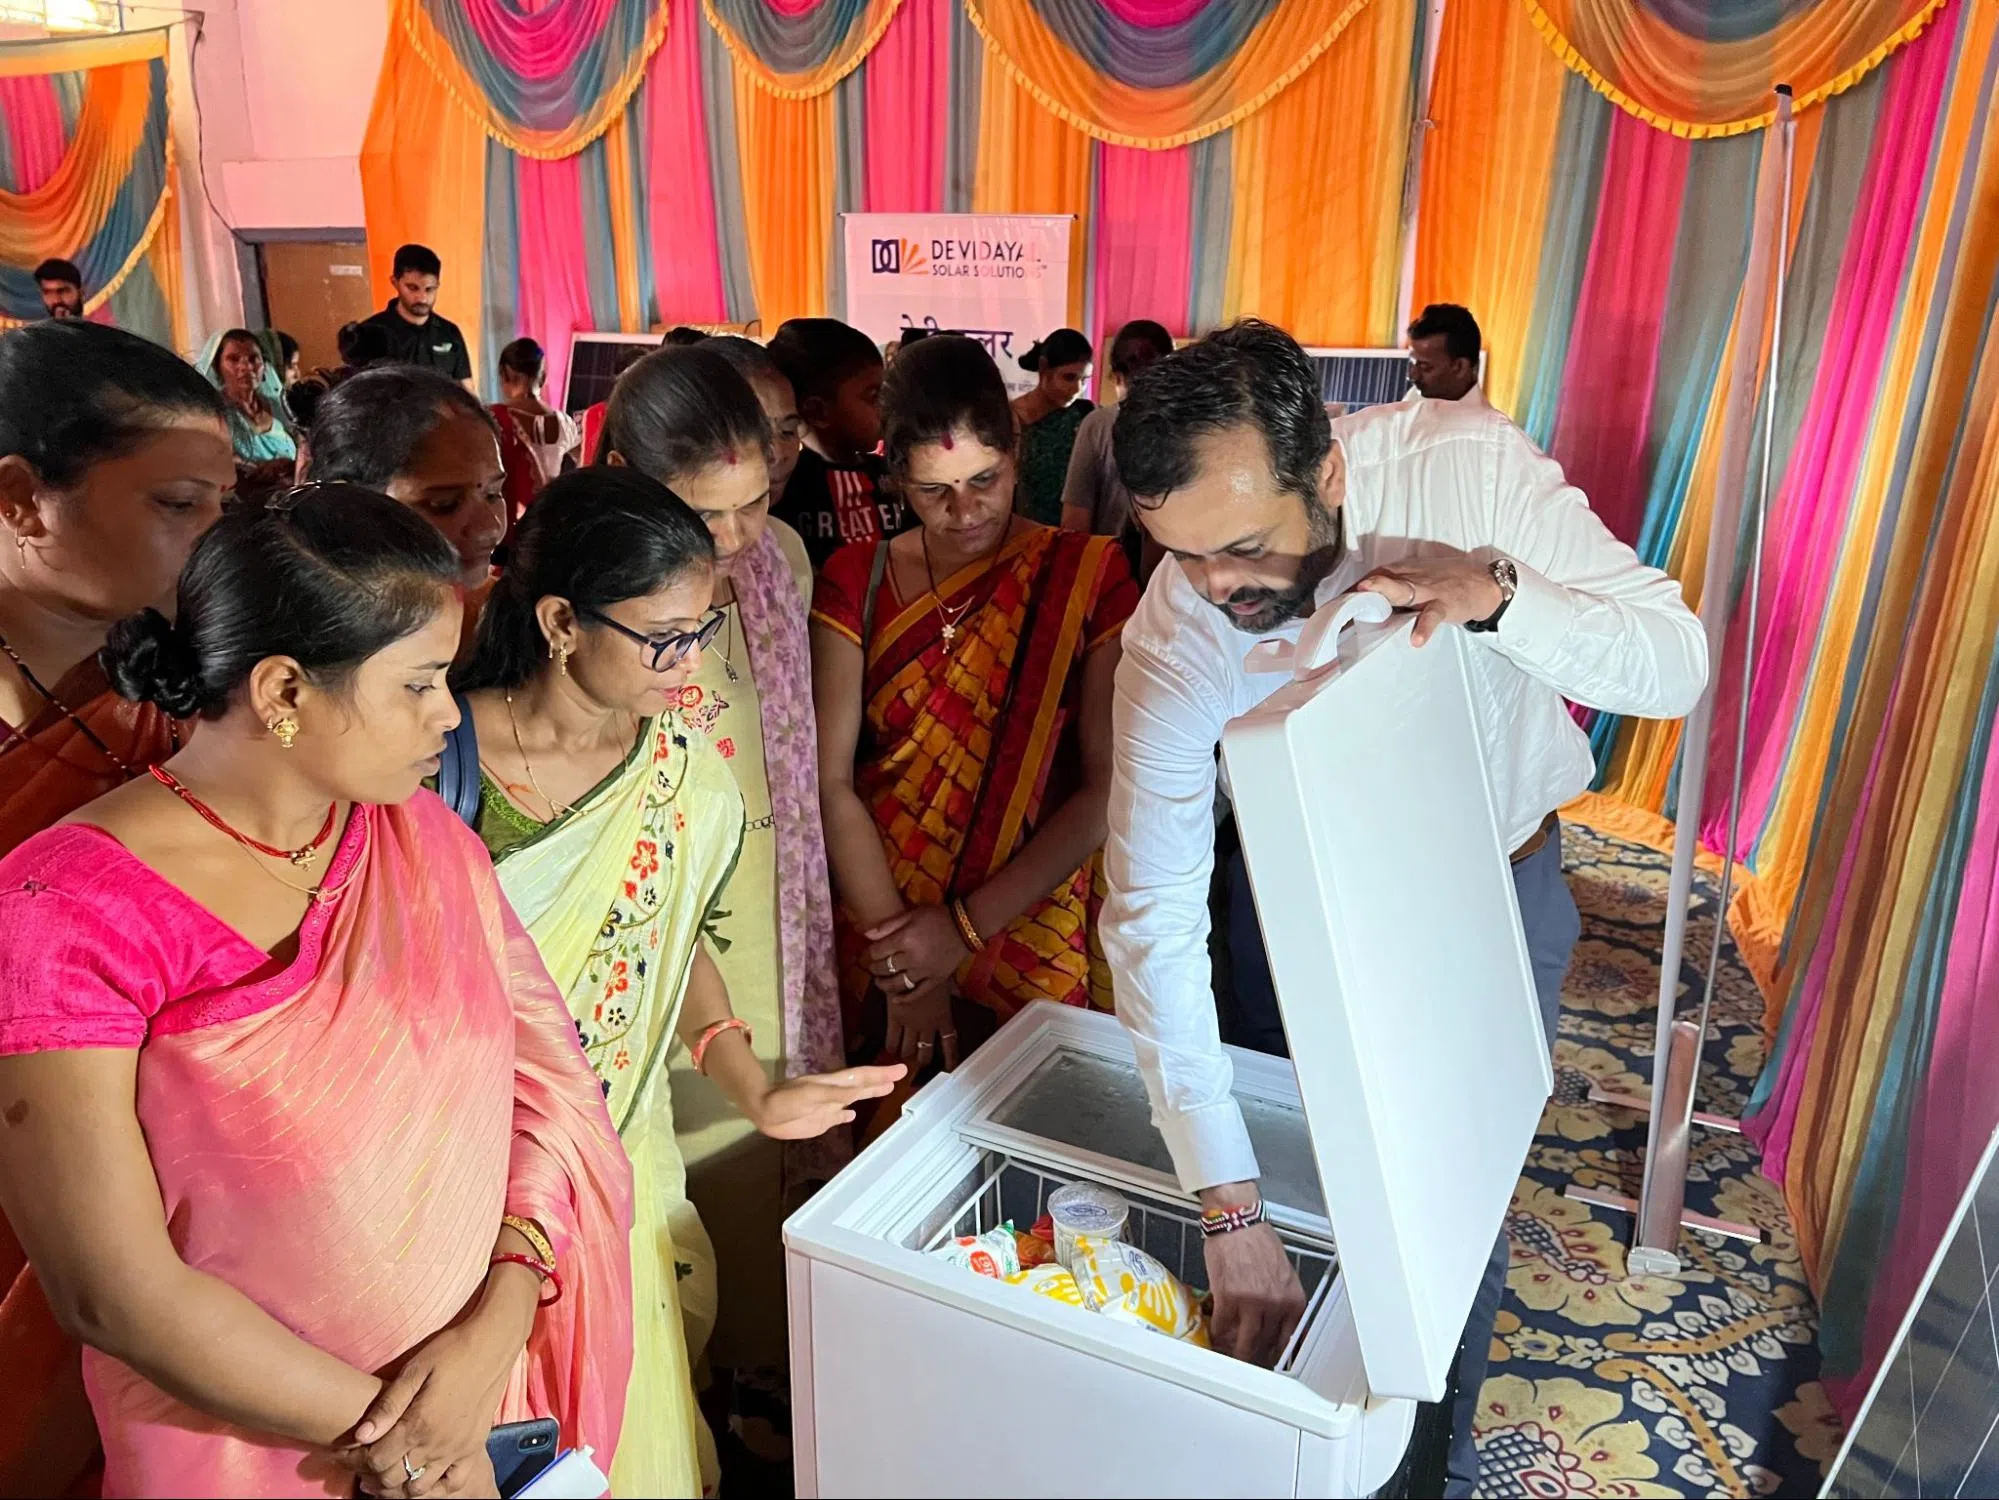
A hyperlocal event conducted in Udaipur, Rajasthan, generated awareness among rural women about the importance of solar refrigerators in dairy farming
Third, initiate cross-sectoral partnerships with national and local players for access and scale. The ground partners have the last-mile reach in rural India, but that alone is not enough. Partnerships with financiers, national and state government initiatives, skilling platforms, and market-linkage partners are crucial. These partnerships extend affordable financing for the end-users, unlock adoption support through government subsidies or interest subvention, enable training on product usage and business models, and help realise income from livelihood activities. Partnering with State Rural Livelihood Missions helped some of the startups reach 1,000+ women from SHG networks generating approximately 100+ leads in Bihar and Uttar Pradesh. Further, 10 FPOs in Maharashtra and Uttar Pradesh got better financing options for cold storage because of the convergence with financiers.
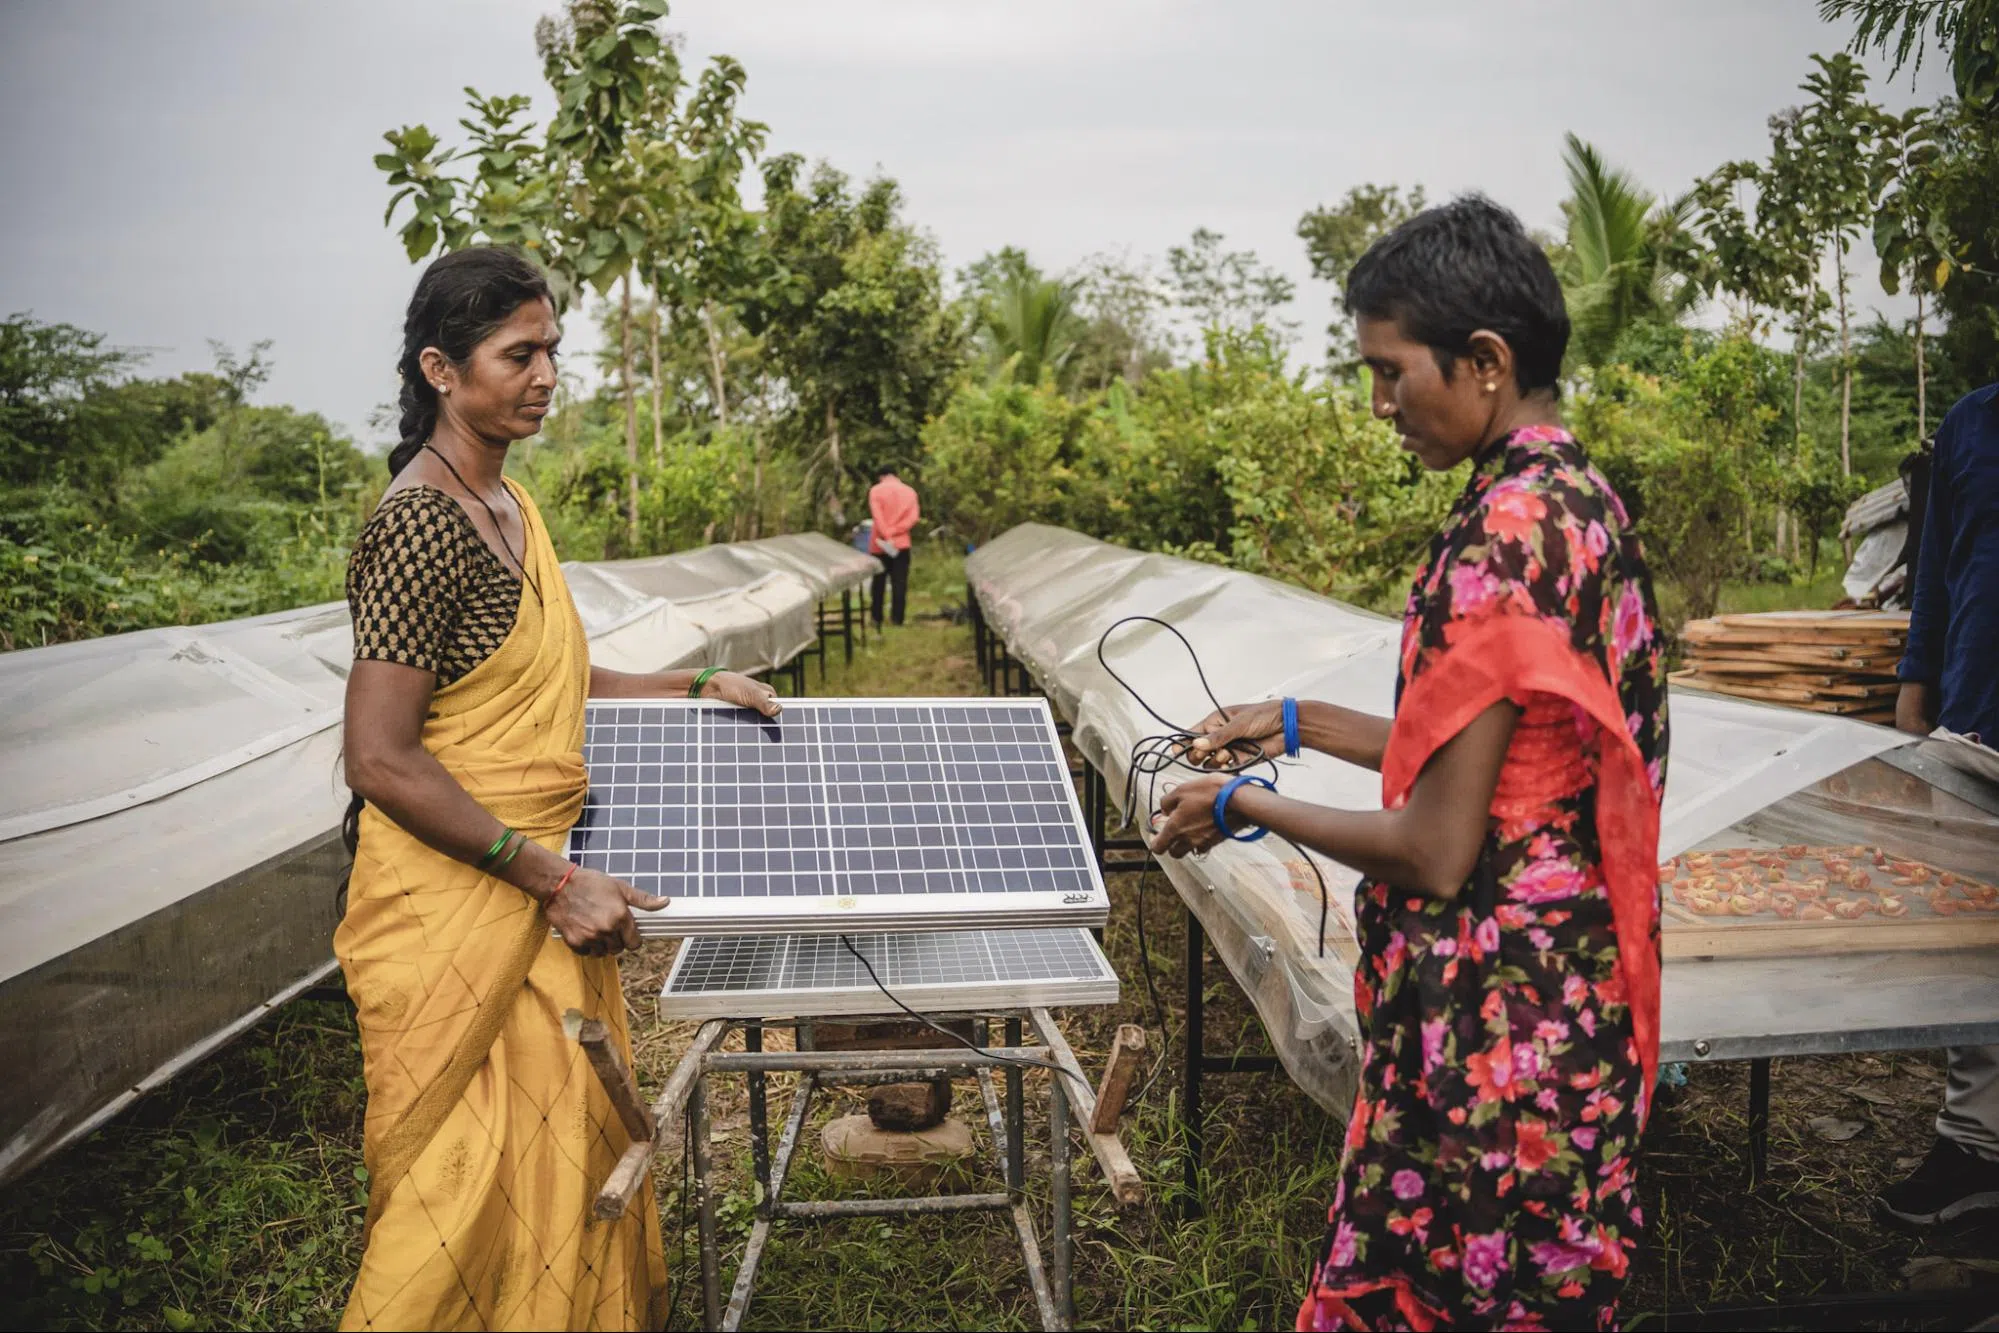
Samunnati Finance facilitated credit services to six women-based FPOs to purchase solar-powered drying units in Andhra Pradesh
The rural distributor partnership has generated 500+ sales of solar dryers for Raheja Solar, further expanding their business from Madhya Pradesh to six other Indian states. Not just Raheja, many more technologies have been deployed through these partnerships, indicating that a strong and robust network of local partners can help startups scale as well as achieve resource optimisation. As India’s startup story soars, effective partnerships will be a fundamental pillar to reaching rural masses as they leverage local expertise, resources and networks. Through effective collaboration, hand-holding support and cross-sectoral partnerships, we could scale the impact of cleantech and act as catalysts in India's path to self-reliant and sustainable green growth.
Divya Gaur is a Programme Associate and Mousumi Kabiraj is a Research Analyst at the Council on Energy, Environment and Water (CEEW), an independent, not-for-profit research organisation. Send your comments to [email protected].
31 October 2023, New Delhi: The Uttar Haryana Bijli Vitran Nigam (UHBVN) is one of the few public power distribution companies (discoms) in India that has gone from high-loss making to financially healthy, according to an independent report released by the Council on Energy, Environment and Water (CEEW) today. The discom reduced its aggregate technical and commercial (AT&C) losses by half—from 34 per cent to 17 per cent—between FY 2015 and FY 2021. AT&C losses are a reflection of the financial health of power discoms. The report also found that in these six years, billing efficiency improved from ~69 per cent to ~83 per cent due to measures such as near-universal metering of consumer connections, efforts to create a unified billing database to ensure timely bill delivery, and special initiatives like Mhara Goan Jagmag Goan for high-loss rural areas.
Achieving India’s commitment of 50 per cent non-fossil fuel capacity by 2030 and a net-zero economy by 2070 requires a fiscally sound power distribution sector. But the majority of Indian discoms have been reeling under huge losses, with national AT&C losses at 22.3 per cent in FY 2021. The report uses UHBVN as a case study as it has cut losses at a significantly higher pace than all-India trends, ranked among the top 10 discoms since FY 2019, and is among the few public discoms in India with a revenue surplus. However, there are several gaps that need to be plugged.
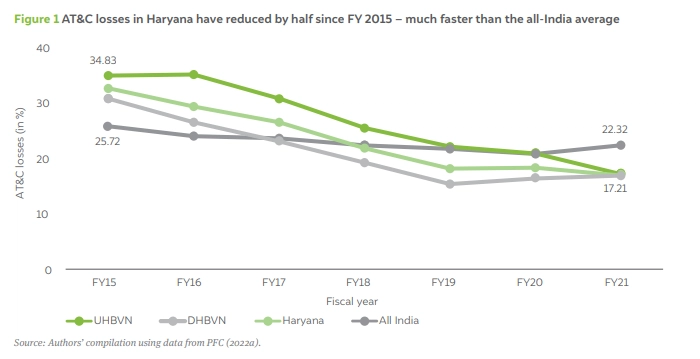
Shalu Agrawal, Senior Programme Lead, CEEW, said, "The past decade witnessed India cross the significant milestone of universal household electrification. This decade will be about fixing the health of our power distribution companies and digitalising them so that they can ensure clean, reliable and affordable electricity. The financial turnaround of UHVBN is an inspiring success story of systemic and concerted efforts from discoms and regulators. The latest numbers from the Power Finance Corporation also point to the progress of UHBVN. For FY2022, UHVBN losses further dropped to 14 per cent, while all Indian AT&C losses reduced to 16.43 per cent.”
The CEEW report also found that despite tremendous progress, there are several areas where UHBVN could improve further. On the discom side, the report found delays in bill distribution, inequitable workload, and inadequate incentives for meter readers impeding progress, particularly in rural areas. There is also a prevalence of electricity theft, which has been a challenge to address. On the consumer side, the report, which surveyed ~1,600 consumers in four high-loss-making circles of UHBVN, found that ~70 per cent of consumers who had filed complaints the year before the survey had their complaints resolved. However, issues such as irregular payments and under-recovery of bills from financially capable consumers still persist.
Bharat Sharma, Programme Associate, CEEW, said, “The financial recovery of Indian state discoms hinges on improved operational efficiency and enhanced consumer trust and engagement. The Revamped Distribution Sector Scheme can address the former through smart meter installation and infrastructure upgrades. However, fostering consumer trust requires targeted actions, like the Mahra Gaon Jagmag Gaon initiative by UHBVN. MGJG reduced losses in rural areas and incentivised villages collectively by linking collection efficiency with supply hours. The UHBVN also institutionalised Bijli Panchayat platform for consumer engagement and awareness. These initiatives offer valuable insights for discoms seeking to build consumer trust and improve revenue recovery.”
A key factor that will underpin the success of India’s leap to a clean and just energy future is the financial health of power distribution companies. To cut their losses, the CEEW report recommends digitalising the power distribution network through smart meters as stipulated under the Revamped Distribution Sector Scheme (RDSS), undertaking a concerted drive to replace faulty meters on priority, improving consumer trust through proactive complaint redressal and introduction of door-to-door payment collection in rural areas combined with a GoDigital campaign.
For media queries contact: Tulshe Agnihotri – [email protected] | +91 9621119643 / +91 7905717812